



Content Curator
Mode formula is one of the measures of central tendency to determine the value of a set of data. It tends to provide information about items that are present in the data set and about the ones that occur frequently in the set.
- In simple terms, the mode is the value that occurs most frequently in the data set.
- Mode is also known as modal value. A given set of data may have one mode or more than one mode.
- In statistics, mode plays an important role to identify which is the one value that occurs most frequently.
- The mode of a set of data is the value that appears most frequently in the data set.
The formula for calculating the mode is:
| Mode = The value that appears most frequently in the data set |
The mode is particularly useful for datasets with discrete values, such as integers or categories, where the frequency of occurrence is of interest. To find the mode, one can simply identify the value that appears most frequently in the dataset.
Also Check: Difference Between Variance and Standard Deviation
| Table of Content |
Key Terms: Statistics, Dataset, Frequency, Cental Tendency, Grouped Data, Frequency Distribution, Modal Class, Ungrouped data, Measures of Dispersion, Ordered Set, Mean, Median
What is Mode?
[Click Here for Sample Questions]
Mode, in statistics, is defined as the value that has a higher frequency in a given set of values. The value that appears the most number of times is mode or modal value.
- In statistics, we represent a data set by a representative value that roughly defines the entire data collection and this representative value is known as the measure of central tendency.
- Central tendency is the value around which the data is centred and it allows us to create a statistical summary of the organized data.
- One such measure of central tendency is called the mode of data.
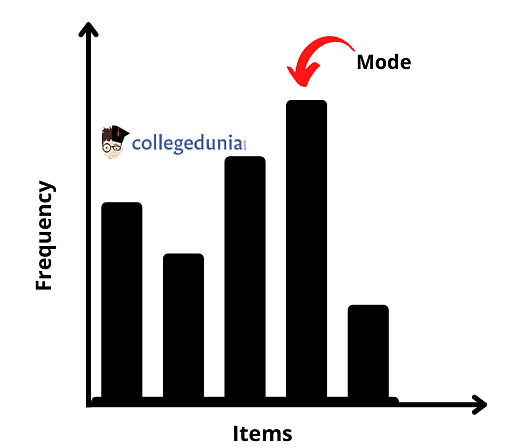
Mode of a Dataset
| Example: The following table represents the number of runs made by the batsman in the first 9 balls. Find the Mode of the given set of data.
Solution: It can be seen that 3 runs are made by the batsman frequently on different balls. Hence, 3 is the Mode of the given data set. |
Mean, Median and Mode Video Explanation
Mode Formula Derivation
[Click Here for Sample Questions]
We consider the modal class of size, determining the mode on basis of it. For the same, consider the graph as represented below. Let the modal class frequency be fm or f1. Here, as can be seen, BC = h.
Also, assume that the preceding modal class is f0, while the frequency of the class succeeding the modal class is f2. Besides, consider that the lower limit of the modal class is I0. Hence, the mode can be represented by I0 + x.
As per the diagram given, it can be seen, △AEB ~ △DEC
Hence, AB/CD = BE/DE = \(\frac{f_{1}-f_{0}}{f_{1}-f_{2}} \)
Also, △BEF ~ △BDC
⇒ FE/BC = BE/BD = \(\frac{f_{1}-f_{0}}{\left(f_{1}-f_{0}\right)+\left(f_{1}-f_{2}\right)}=\frac{f_{1}-f_{0}}{2 f_{1}-f_{0}-f_{2}} \)
FE = \(\frac{f_{1}-f_{0}}{2 f_{1}-f_{0}-f_{2}} \times B C=\left(\frac{f_{1}-f_{0}}{2 f_{1}-f_{0}-f_{2}}\right) h \)
Thus, it can be seen that:
x = \(\left(\frac{f_{1}-f_{0}}{2 f_{1}-f_{0}-f_{2}}\right) h \)
Hence, the mode can be shown by:
I0 + x = I0 + \(\left(\frac{f_{1}-f_{0}}{2 f_{1}-f_{0}-f_{2}}\right) h \)
Also Check:
| Relevant Topics | ||
|---|---|---|
| Frequency Polygon | Mean and Variance of Random Variable | Difference between Mean and Median |
| Interquartile Range | Statistics Formula | Coefficient of Variation Formula |
Types of Mode
[Click Here for Sample Questions]
There are different types of mode as a dataset may have more than mode. The resective types of mode are discussed below:
Unimodal Mode
A set of data with one mode is known as unimodal mode.
For Example: In data set A = { 14, 15, 16, 17, 15, 18, 15, 19} there is only one mode 15 as there is only one value repeating itself. Hence, it is a Unimodal data set.
Bimodal Mode
A set of data with two modes is known as a bimodal mode. It means that there are two data values that are having the highest frequencies.
For Example: In the data set A = { 8,12,12,14,15,17,17,19} there two modes,12 and 17 because both 12 and 17 are repeated twice in the given set. Hence, it is a Bimodal data set.
Trimodal Mode
A set of data with three modes is known as a trimodal mode. It means that there are three data values that are having the highest frequencies.
For Example: In the data set A = {2, 2, 2, 3, 4, 4, 5, 6, 5,4, 7, 5, 8} there are three modes, 2, 4, and 5 because all the three values are repeating thrice in the given set. Hence, it is a Trimodal data set.
Multimodal Mode
A set of data with four or more than four Modes is known as a Multimodal Mode.
For Example: In the data set A = {100, 80, 80, 95, 95, 100, 90, 90, 102, 95 } is 80, 90, 95, and 102 because all four values are repeated twice in the given set. Hence, it is a Multimodal data set.
Also read:
How to Find Mode Formula?
[Click Here for Sample Questions]
To find the mode of a set of data, the value or values that occur most frequently should be identified first. Here are the steps to find the mode:
- Organize the data in numerical order.
- Count the number of times each value appears in the data.
- Identify the value or values that occur most frequently. These are the modes.
In case there is one value occurring most frequently, then the data has a single mode. If two or more values occur most frequently, then the data has multiple modes.
For example, assume the following set of data: 2, 3, 4, 4, 4, 6, 7, 7, 7, 9, 9, 7, 7
Then organize the data in numerical order: 2, 3, 4, 4, 4, 6, 7, 7, 7, 7, 7, 9, 9
Further, count the number of times every value occurs in the data:
- 2 appears once
- 3 appears once
- 4 appears thrice
- 6 appears once
- 7 appears five times
- 9 appears twice
The value 7 appears most frequently, which is five times, so the mode is 7.
Mode Formula for Ungrouped Data
[Click Here for Sample Questions]
Mode for ungrouped data can be found easily after arranging the data values either in ascending or descending order, so that we can easily recognise the repeated values and their frequency. Hence, the observation with the highest frequency will be the mode of the given data. Alternatively, we can form a frequency distribution table to get the mode.
Thus, the mode formula for ungrouped data is:
| Mode Formula for Grouped Data = The most frequently occurred value in the Dataset |
To understand better an example is illustrated below.
Solved ExampleFind the mode of the following marks obtained by 25 students in a mathematics test out of 50. 34, 46, 45, 39, 43, 22, 27, 37, 46, 35, 34, 39, 40, 30, 30, 41, 37, 46, 39, 29, 34, 39, 35, 43, 30 Here, ascending order of the data is: 22, 27, 29, 30, 30, 30, 34, 34, 34, 35, 35, 37, 37, 39, 39, 39, 39, 40, 41, 43, 43, 45, 46, 46, 46 The most frequently occurred value is 39. Hence, the mode of given marks is 39. |
Also Read:
Mode for Grouped Data
[Click Here for Sample Questions]
In a grouped frequency distribution, unlike ungrouped data, it isn’t possible to determine the mode by looking at the frequencies. In this case, we can only locate a class with the maximum frequency, called the modal class. The mode is a value that lies in the modal class and is calculated using the formula given below:
| Mode = \( l+{{f_1-f_0} \over 2f_1 - f_0 - f_2}\times{h}\) |
Here,
l = Lower limit of the modal class
h = Size of the class interval (assuming all class sizes to be equal)
f1 = Frequency of the modal class
f0 = Frequency of the class preceding the modal class
f2 = Frequency of the class succeeding the modal class
Solved ExampleQues: Calculate the mode of the following frequency distribution.
Ans: From the given table, The highest frequency = 20 and lies in the interval 50-60. Thus, it is the modal class. Modal class = 50 – 60 l = Lower limit of the modal class = 50 h = Size of the class interval = 10 f1 = Frequency of the modal class = 20 f0 = Frequency of the class preceding the modal class = 12 f2 = Frequency of the class succeeding the modal class = 11 Mode = \( l+{{f_1-f_0} \over 2f_1 - f_0 - f_2}\times{h}\) Mode = 50 + [80/ (40 – 23)] Mode = 50 + (80/17) Mode = 50 + 4.706 Mode = 54.706 |
Things to Remember
- Mode is one of the measures of central tendency to determine the value of a set of data.
- In statistics, we represent a set of data by a representative value that roughly defines the entire data collection and this representative value is known as the measure of central tendency.
- A set of data with one mode is known as unimodal mode, with two modes bimodal mode and so on.
- A set of data with four or more than four modes is known as a multimodal mode.
- The mode of grouped data is given by the formula \( l+{{f_1-f_0} \over 2f_1 - f_0 - f_2}\times{h}\).
Join Our Telegram Channel for Live Updates on Board Exams: https://t.me/class_10_12_board_updates
Sample Questions
Ques: What is the mode of 2, 5, 7, 5, 2, 5, 5, 3? (2 Marks)
Ans: The number which is repeated most number of times is called mode.
Here the number 5 is repeated most number of times so mode is 5.
Ques: Mode of the data 35, 38, 32, 35, 38, 39 is? (2 Marks)
Ans: Here the mode is 35, repeated most times.
Ques: Difference between mode and median? (3 Marks)
Ans: The number which is repeated the most number of times is called the mode while the median is defined as the middle value of a sorted list of numbers.
Ques: Give a brief comparison between mean, median and mode. (4 Marks)
Ans: A brief comparison between mean, median and mode is given below:
| Mean | Median | Mode |
|---|---|---|
| Mean is the average value that is equal to the ratio of the sum of values in a data set and the total number of values. Mean = Sum of observations/Number of observations | The median is the central value of given set of values when arranged in an order. | Mode is the most repetitive value of a given set of values. |
For example, if we have set of values = 2,2,3,4,5, then;
Mean = (2+2+3+4+5)/5 = 3.2
Median = 3
Mode = 2
Ques: Find the mode of 4, 4, 4, 9, 15, 15, 15, 27, 37, 48 data set. (3 Marks)
Ans: Given data set is:
4, 4, 4, 9, 15, 15, 15, 27, 37, 48
We know that, a data set can have more than one mode if more than one value occurs with equal frequency and number of time compared to the other values in the set.
Hence, here both the number 4 and 15 are modes of the set.
Ques:Find the mode of 3, 6, 9, 16, 27, 37, 48. (2 Marks)
Ans: If no value or number in a data set appears more than once, then the set has no mode.
Hence, for set 3, 6, 9, 16, 27, 37, 48, there is no mode available.
Ques: Define radial acceleration. (2 Marks)
Ans: When there is an acceleration of an object along the radius directed towards the centre, it is known as radial acceleration. It is expressed as radian/sec2.
Ques: Give a formula establishing a relation between mean, median and mode. (2 Marks)
Ans: There exists an empirical relationship between mode, median and mean and this can be expressed using the formula:
Mode = 3 Median – 2 Mean
Ques: Define no mode condition. (1 Mark)
Ans: If the given set of observations do not have any value that is repeated in the set, more than once, then it is said to be no mode.
Ques: What are trimodal and multimodal modes? (1 Mark)
Ans: If in a data set, there are three modes, then it is called trimodal mode and if there are four or more than four modes then it is called multimodal mode.
Ques: Determine the mode of the ungrouped data from the table below. (2 Marks)

As can be seen,
The car with the Silver colour has the highest frequency of all. Hence, the mode is 23.
∴ Mode = 23.
Also Read:



Comments