



Content Curator
Mean Deviation is a statistical measure that is used to determine the typical deviation from the mean value of the provided data set.
- It demonstrates the average distance between all of the observations and the middle.
- Each deviation is an absolute deviation since it has an absolute value, meaning that the negative signs should be ignored.
- Additionally, the deviations from the mean on both sides must be equal.
- The deviation is a metric used in statistics and mathematics to determine the discrepancy between an observed value and an expected value of a variable.
- The deviation can be defined as the distance from the center point.
Also read: Mean Absolute Deviation
Key terms: Mean, Median, Mode, Class Mark, Statistics, Probability Distribution, Random Variable, Data Set
What is Mean Deviation ?
[Click Here for Sample Questions]
Mean Deviation is a statistical metric that calculates the standard deviation of a given data collection.
Different data series, including continuous data series, discrete data series, and individual data series, can be used to compute the mean deviation.
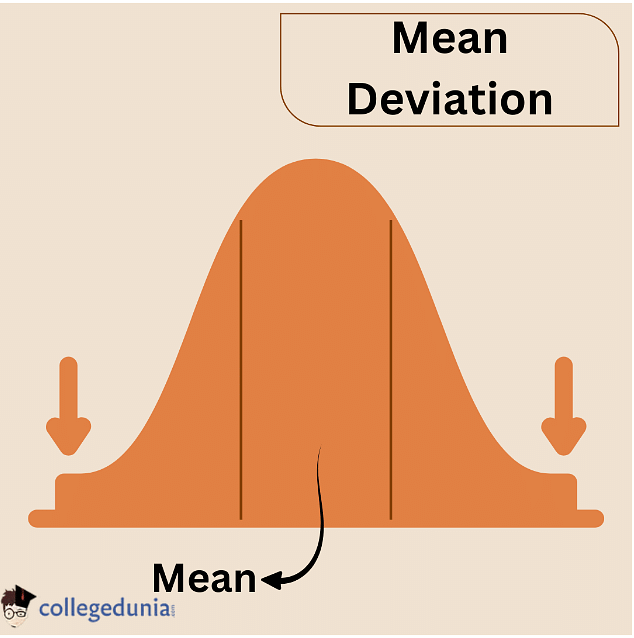
Mean Deviation Diagram
Mean Deviation Formula
[Click Here for Previous Year Questions]
The formula for Mean Deviation Formula is as follows-
∑ |X – \(\bar{X}\)| / N
- X = represents each value in the set of data.
- \(\bar{X}\) = indicates the data set's average value.
- N= number of data values overall
- | | = omits the sign and reflects absolute value.
Also Read:
| Relevant Topics | ||
|---|---|---|
| Measures of Dispersion | Degree of polynomial | Mean Value Theorem |
Class intervals are the main component of this kind of grouped data. The continuous frequency distribution indicates how often an observation is repeated within each interval.
The formula is given below:
MAD = \(\frac{\sum _1^n f_i |x_i - \bar{x}|}{\sum _1^n f_i}\)
The specific data points in this sort of data are listed, along with their frequency of occurrence. For this the formula is given below:
MAD = \(\frac{\sum _1^n f_i |x_i - \bar{x}|}{\sum _1^n f_i}\)
Data that has been structured and categorized into groups is referred to as grouped data. Continuous and discrete frequency distributions are used to group data.
Also read: Difference Between Relation and Function
Mean Deviation for Frequency Distribution
[Click Here for Sample Questions]
We group the data and describe the frequency distribution of each group in order to provide it in a more condensed format. Class intervals are the names of these teams.
Data can be divided in two different ways :
- Grouped data
- Ungrouped data
Mean Deviation Formula for Grouped Data
When data is organized and classified into groups it is known as grouped data. The mean deviation formulas for grouped data are under 2 categories that are given below:
- Discrete Frequency Distribution
- Continuous Frequency Distribution
Also Check: Mean Deviation Continuous Frequency Distribution
Mean Deviation for Discrete Distribution Frequency
Discrete refers to something that is distinct or non-continuous. The frequency (number of observations) in this type of distribution is discrete by nature. A representation of data is called a discrete distribution of frequency if it contains values x1, x2, x3,... xn that occur with frequencies of f1, f2,... fn, correspondingly.
The steps below are used to determine the mean deviation for grouped data, particularly for data with discrete distributions:
Step I: The measure of central tendency that will be used to determine mean deviation is calculated. Consider this measure be = a. The calculation is as follows if this measure is the mean:
\(\bar{X}\) = \(\frac{\sum^n_{i=1} x_if_i}{\sum^n_{i=1} f_i}\)
⇒ \(\bar{X}\) = \(\frac{1}{N} \)\(\sum_{i=1}^n\) xifi
Where,
N = \(\sum_{i=1}^n f_i\)
If the measure is median, the given set of data is arranged in ascending order, the cumulative frequency is computed, and the observations whose cumulative frequency is equal to or just greater than N/2 are taken as the median for the given discrete frequency distribution. It is then obvious that this value falls in the middle of the frequency distribution.
- Step II: Determine each observation's absolute departure from the central tendency value determined in Step I.
- Step III: Using the formula, determine the mean absolute deviation from the central tendency measure.
M.A.D (a) = \(\frac{\sum _1^n f_i |x_i - a|}{N}\)
When Central Tendency is Mean then:
M.A.D (\(\bar{x}\)) = \(\frac{\sum _1^n f_i |x_i - \bar{x}|}{N}\)
When central tendency is median then:
M.A.D (M) = \(\frac{\sum _1^n f_i |x_i - M|}{N}\)
Mean Deviation for Continuous Frequency Distribution
Such a type of grouped data consists of class intervals. The frequency of repetition of an observation within each interval is given by the continuous frequency distribution. The mean deviation formula is as follows:
MAD = \(\frac{\sum _1^n f_i |x_i - \bar{x}|}{\sum _1^n f_i}\)
fi is the frequency of repetition of xi.xi denotes the mid value of the class interval.
Read More: Mean of Grouped Data
Mean Deviation Formula for Ungrouped Data
Data that is not sorted or classified into groups and remains in raw form is known as ungrouped data. To calculate the mean deviation for ungrouped data the formula is as follows:
MAD = \(\frac{\sum _1^n|x_i - \bar{x}|}{n}\)
Here,
Xi represents the ith observation,x¯ represents the central point (mean, median, or mode), and 'n' is the number of observations in the data set.
Mean Deviation about Mean
[Click Here for Previous Year Questions]
The expected value of a data collection is another name for the mean. The sum of all observations divided by the total number of observations is the straightforward definition of mean.The formula for the following is given below:
- Ungrouped data MAD = \(\frac{\sum_1^n |x_i - \mu|}{n}\)
where, mean is μ = \(\frac{x_1 +x_2+...+x_n}{n}\)
- Continuous and discrete frequency distribution MAD = \(\frac{\sum^n_1 f_i |x_i - \mu|}{\sum^n_1 f_i}\)
Where, the mean of grouped data is \(\frac{\sum^n_1 x_if_i}{\sum^n_1 f_i}\)
Mean Deviation about Median
[Click Here for Sample Questions]
The median is the number in the middle of a sorted, ascending or descending list of numbers.
For Individual Data
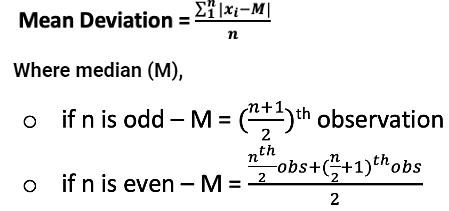
For Discrete Data

The median of discrete data is calculated as above
For Continuous Data

where,
- c.f = the average frequency before the median class
- l = a lower median class value
- f = the median class's frequency
- h = the median class's length
Also read: Difference between Sequence and Series
Mean Deviation about Mode
[Click Here for Previous Year Questions]
The mode is the value that appears the most frequently in a particular data set. The following are the formulas to determine mean deviation from the mode:
Mean deviation For Individual Data
Formula for mean deviation in individual data is :

where, mode = most frequent value in the set of data
Mean Deviation For Discrete Data
The formula for mean deviation in discrete data is as follows:

Mean Deviation for For Continuous Data
The formula for mean deviation in continuous data is :

where,
l = decrease in the modal class's value
h = the modal class's size
f = how often the modal class occurs
f1 =frequency of the modal class's preceding class
f2 = the likelihood that a class will follow the modal class
Also read: Statistics Revision Notes
Calculating Mean Deviation
[Click Here for Sample Questions]
Steps to calculate Mean Deviation with example with the help of a question below:
Determine the mean deviation from the mean for a dataset with the values 3, 5, 7, and 9.
- We determine the dataset's mean, which is (3+5+7+9)/4 = 6
- Then, we calculate the absolute values of each value in the data set by subtracting it from the mean, as in |3-6| = 3, |5-6| = 1, |7-6| = 1 , and |9-6| = 3.
- In other words, 3 + 1 + 1 + 3 Equals 8.
- The mean deviation is then calculated by dividing this amount by the dataset's (4) total number of values. The solution is 2 (8/4).
Advantages and Disadvantages of Mean Deviation
[Click Here for Previous Year Questions]
The advantages and disadvantages of mean deviation are described as follows:
Advantages of Mean Deviation
The advantages of mean deviation are:
- The calculation and understanding of mean deviation are simpler in nature.
- All the components of the data set are taken into account while calculating mean deviation.
- This statistical measure has the lowest sample volatility when compared to other measures.
- Because it is based on departures from the mean, it is a valuable comparison metric.
Disadvantages of Mean Deviation
Mean deviation have some disadvantages:
- As mean deviation can be estimated in relation to the mean, median, and mode, it is not precisely defined.
- As we employ the absolute value, we see both adverse and favorable signs. The outcome may be inaccurate as a result.
- The mean deviation from the various averages (Mean, Median and Mode) will vary, it is not a statistic with a clear definition.
- It cannot be algebraically processed any further.
- The variations in the sampling have a big effect on it.
Difference between Mean Deviation and Standard Deviation
[Click Here for Sample Questions]
The difference between mean deviation and standard deviation are as follows :
| Mean Deviation | Standard Deviation |
|---|---|
| The mean absolute deviation is used when there are more outliers in the data. | The standard deviation is used when there are fewer outliers in the data. |
| It is not used as frequently. | It is one of the most often employed metrics of variability. |
| We consider the absolute value of the deviations in order to determine the mean deviation. | To determine the standard deviation, we square the deviations. |
| To get the mean deviation, we use the central points (mean, median, and mode). | We only use the mean when calculating the standard deviation. |
Also check: Difference Between Variance and Standard Deviation
Things to Remember
- The average deviation from the mean value of the provided data set is determined using the mean deviation, which is defined as a statistical metric.
- Mean deviation is straightforward to compute and comprehend. As a result, mean deviation is used frequently in daily life by numerous working individuals from various industries.
- The central tendency is measured by the mean deviation. It explains how far out from the middle, on average, all of the observations are.
- The deviation is a measurement used in statistics and mathematics to find the discrepancy between an observed value and an expected value of a variable.
Also read:
| Chapter Related Topics | ||
|---|---|---|
| Mean and Variance of Random Variable | Bayes Theorem | Difference Between Mean and Median |
| Frequency Distribution Table Statistics | Conditional Probability | Frequency Polygon |
Previous Year Questions
- The mean and variance of 7 observations are 8 and…
- A bag contains (2n+1) coins. It is known that n of these coins have a head on ….[KCET 2015]
- A and B each select one number at random from the distinct numbers 1,2,3 ...[WBJEE 2019]
- Two dice are thrown simultaneously, the probability of ….[KCET 2016]
- A bag contains 2n coins out of which n−1n−1 are unfair with ….[BITSAT 2019]
- The mean and variance of 20 observations are found to… (JEE Main 2020)
- The variance of the numbers 2, 3, 11 and x is…
- Two cards are drawn at random from a pack of 52 cards ….(KCET 2016)
- Probability of four sons to a couple is…..(NEET 2001)
Sample Questions
Ques. There are 20 juniors, 15 seniors, and 5 graduate students in a given class. What roughly is the mean of the center class if the junior had a midterm test average of 65, the senior had a mean of 70, and the graduate students had a mean of 91? (2 Marks)
Ans. The combined mean is calculated as follows: (xini)/(ni) = (20* 65 + 15 *70 + 5 *91)/(20 + 15 + 5) = 70.
Ques.Find the mean deviation for the following data points: 5, 3, 7, 8, 4, and 9. (3 Marks)
Ans. The values of the data are 5, 3, 7, 8, 4, and 9.
Find the mean for the supplied data first:
Mean = ( 5+3+7+8+4+9)/6
Mean = 36/6
Mean = 6
Consequently, 6 is the mean value.
Next, deduct each mean from the data value, ignoring any minus signs.
5 – 6 = 1
3 – 6 = 3
7 – 6 = 1
8 – 6 = 2
4 – 6 = 2
9 – 6 = 3
The collected data set is currently 1,3,1,2,2,3.
the average deviation is
= (1+3+1+2+2+3) /6
= 12/6
= 2
The mean deviation for the numbers 5, 3, 7, 8, 4, and 9 is 2.
Ques: Calculate the mean deviation about the mean of the set of first n natural numbers when n is an even number. (3 Marks)
Ans: Natural numbers are: 1, 2, 3, 4, 5,…., n (even)
Sum of these natural numbers = n(n + 1)/2
Mean (x̄) = [n(n + 1)/2]/ n = (n + 1)/2
Mean deviation = 
Ques: Find the mean deviation about the median for the following data. (5 marks)

Ans: Let us write the given data in an ascending order and calculate the cumulative frequency for the same, as follows:
| Marks (xi) | 20 | 25 | 28 | 29 | 33 | 38 | 42 | 43 |
| Number of students (fi) | 6 | 20 | 24 | 28 | 15 | 4 | 2 | 1 |
| Cumulative frequency | 6 | 26 | 50 | 78 | 93 | 97 | 99 | 100 |
Here, N = 100
Median = (28 + 29)/2 = 28.5
The absolute values of the respective deviations from the median, i.e., |xi − M| are:
|20 – 28.5|, |25 – 28.5|, |28 – 28.5|, |29 – 28.5|, |33 – 28.5|, |38 – 28.5|, |42 – 28.5|, |43 – 28.5|
= 8.5, 3.5, 0.5, 0.5, 4.5, 9.5, 13.5, 14.5
Mean deviation = ∑fi|xi – M|/ N
= [6(8.5) + 20(3.5) + 24(0.5) + 28(0.5) + 15(4.5) + 4(9.5) + 2(13.5) + 1(14.5)]/ 100
= 294/100
= 2.94
Therefore, the mean deviation about the median of the given data is 2.94.
Ques: Estimate the mean deviation about median for the following data. (5 marks)

Ans: Let's write the given data into proper frequency range:
| Classes | 0 – 10 | 10 – 20 | 20 – 30 | 30 – 40 | 40 – 50 | 50 – 60 |
| Frequency | 11 | 30 | 17 | 4 | 5 | 3 |
| Mid Values (xi) | 5 | 15 | 25 | 35 | 45 | 55 |
| Cumulative frequency | 11 | 41 | 58 | 62 | 67 | 70 |
Here, N = 70
N/2 = 70/2 = 35
Cumulative frequency greater than and nearer to 35 is 41, which lies in the class interval 10 – 20.
Median class=10 – 20
l = Lower limit of the median class=10
f = Frequency of the median class=30
cf = Cumulative frequency preceding the median class=11
h = Class height = 10
Median = l + h [(N/2) – cf]/f
= 10 + 10 × [(35 – 11)/30]
= 10 + (24 × 10/30)
= 10 + 8
= 18
The absolute values of the respective deviations from the median, i.e., |xi − M| are:
|5 – 18|, |15 – 18|, |25 – 18|, |35 – 18|, |45 – 18|, |55 – 18|
= 7, 3, 7, 17, 27, 37
Mean deviation = ∑fi|xi – M|/ N
= [11(7) + 30(3) + 17(7) + 4(17) + 5(27) + 3(37)]/ 70
= 600/70
= 8.57 (approx)
Ques:. Calculate the mean deviation about the mean of the set of the first 10 natural numbers. (3 marks)
Ans: First 10 natural numbers: 1, 2, 3, 4, 5, 6, 7, 8, 9, 10
Mean = (1 + 2 + 3 + 4 + 5 + 6 + 7 + 8 + 9 + 10)/10
= 55/10
= 5.5
|xi – x̄| = |1 – 5.5|, |2 – 5.5|, |3 – 5.5|, |4 – 5.5|, |5 – 5.5|, |6 – 5.5|, |7 – 5.5|, |8 – 5.5|, |9 – 5.5|, |10 – 5.5|
= 4.5, 3.5, 2.5, 1.5, 0.5, 0.5, 1.5, 2.5, 3.5, 4.5
Mean deviation = ∑|xi – x̄|/ n
= (4.5 + 3.5 + 2.5 + 1.5 + 0.5 + 0.5 + 1.5 + 2.5 + 3.5 + 4.5)/10
= 25/10
= 2.5
Thus, the mean deviation about the mean for the first 10 natural numbers is 2.5.
Ques.What three methods are there for calculating the mean deviation? (3 Marks)
Ans.The three methods are-
- Individual Series
- Continuous series
- Discrete series
After determining the median, subtract it from each data point's value before averaging the results.
Ques. What is the meaning of the mean deviation? (1 Mark)
Ans. The mean deviation reveals how widely the data values deviate from the mean value.
Ques.Describe how to calculate the mean deviation. (3 Marks)
Ans.Following are the steps to determine the mean deviation:
First, determine the mean value for the provided data.
Step 2: Remove the mean from each value of the data (Distance)
Step 3: Finally, calculate the distance's mean.
Ques.What benefits come with employing the mean deviation? (2 Marks)
Ans.The benefits of utilizing mean deviation include:
- It will provide a better measure of dispersion because it is based on all the data values offered.
- It is simple to comprehend and compute.
Ques.What is a median's mean deviation? (3 Marks)
Ans.Similar to the mean deviation about the mean is the mean deviation about the median. Find the median value by arranging the data values in ascending order, then find the middle value, rather than computing the mean for the given set of data values. After determining the median, subtract it from each data point's value before averaging the results.
Ques.What is a median's mean deviation? (1 Mark)
Ans.Similar to the mean deviation about the mean is the mean deviation about the median. Find the median value by arranging the data values in ascending order, then find the middle value, rather than computing the mean for the given set of data values.
For Latest Updates on Upcoming Board Exams, Click Here: https://t.me/class_10_12_board_updates
Also Read:



Comments