



Content Writer
Assumed Mean Method is used to calculate the arithmetic mean of grouped data. It helps to reduce the calculations and results in small numerical values, which makes it easy to calculate the mean easily with no long calculations.
- Assumed mean method is recommended if the given data is large.
- The direct method for calculating the mean is not suitable in the case.
- The method depends on assuming the mean and rounding to an easy value to calculate.
- The value obtained is subtracted from all the sample values.
- A central class is chosen when the samples are converted into equal-size ranges or class intervals and the calculations are performed.
- Assumed Mean can be calculated using the formula
a + (Σfidi /Σfi).
where,
- a denotes the assumed mean
- fi is the frequency of the ith class
- di is the deviation of the ith class
- Σfi refers to the total number of observations
- xi is the class mark.
Related Links
- Appearing for JEE Main, Download JEE Mains PYQ for all sabjects
- Appearing for CUET, Download CUET PYQ for all subjects
| Table of Content |
Key Terms: Assumed Mean Method, Mean, Assumed Mean, Arithmetic Mean, Step-deviation Method, Grouped Data, Class Mark, Class Interval
Assumed Mean Method
[Click Here for Sample Questions]
Assumed mean method is used for calculating the arithmetic mean in Statistics. The mean of grouped data refers to the average of a set of data that are grouped together in different categories.
- There are three main methods of calculating the mean of grouped data, namely the direct method, the assumed mean method, and the step deviation method.
- Assumed Mean Method is the most feasible option to calculate the mean.
- It is also used to find out the standard deviation of a data set.
- Assumed mean method simplifies the calculation of the mean of the grouped data in comparison to the direct method.
- The method is generally used for data sets with large values or samples.
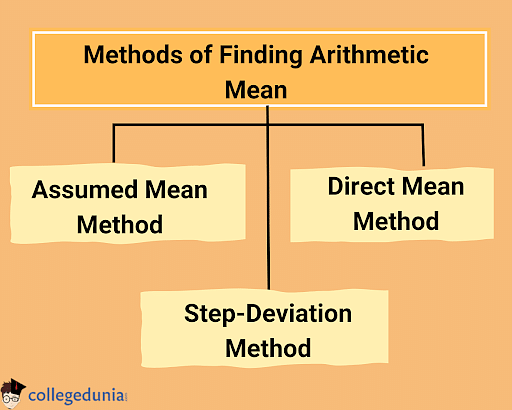
Methods to Find Arithmetic Mean
The video below explains this:
Assumed Mean Method Detailed Video Explanation:
Read More:
| Relevant Topics | ||
|---|---|---|
| Difference between Mean and Median | Mode | Median |
| Median of Grouped Data | Mean Absolute Deviation | Statistics Formulas |
Assumed Mean Method Formula
[Click Here for Sample Questions]
Assumed Mean Method Formula helps to calculate the mean for large data values. Let x1, x2, x3,…, and xn be mid-points or class marks of n class intervals. f1, f2, f3, …, and fn are the respective frequencies. The assumed mean method formula is:
\(\bar{x} = a + \frac{\sum f_id_i}{\sum f_i}\)Where
- a: Assumed Mean
- fi: Frequency of ith Class
- di = xi – a: Deviation of ith Class
- Σfi= n: Total Number of Observations
- xi = Class Mark: (Upper-Class Limit + Lower-Class Limit) / 2
Read More: Weighted Mean Formula
How to Calculate Mean using Assumed Mean Method?
[Click Here for Sample Questions]
In order to calculate the mean of grouped data using the assumed mean method, one needs to follow the given steps:
- First, calculate the midpoint or xi for the class interval.
- Take the central value from the class marks as the assumed mean and mark it as a.
- Now, calculate the deviation di = xi - a for each i.
- Calculate the product of difi for each i.
- Now, find the total of fi.
- Lastly, calculate the mean by using the assumed mean method = a + ∑difi / ∑fi.
Read More: Frequency Distribution Table
Solved Examples on Assumed Mean Method
[Click Here for Sample Questions]
Given below are some examples of calculating the mean of grouped data by the assumed mean method:
Example 1: The table given below shows the marks obtained by 110 students in class. What will be the mean marks of the students? Use the assumed mean method.
| Class | 0-10 | 10-20 | 20-30 | 30-40 | 40-50 |
| Frequency | 12 | 28 | 32 | 25 | 13 |
Solution: The given data is:
| Class (Ci) | Frequency (fi) | Class mark (xi) | di = xi – a | fidi |
|---|---|---|---|---|
| 0-10 | 12 | 5 | 5 – 25 = – 20 | -240 |
| 10-20 | 28 | 15 | 15 – 25 = – 10 | -280 |
| 20-30 | 32 | 25 = a | 25-25 = 0 | 0 |
| 30-40 | 25 | 35 | 35-25 = 10 | 250 |
| 40-50 | 13 | 45 | 45-25 = 20 | 260 |
| Total | Σfi =110 | Σfidi = -10 |
- Let us take Assumed mean = a = 25
- Using the Assumed Mean Method
- Mean = a + (Σfidi / Σfi)
- 25 + (-10 / 110)
- 25 – ( 1 / 11)
- (275 – 1) / 11
- 274 / 11 = 24.9
Thus, the mean marks of the students in the class are 24.9.
Read More: Cumulative Frequency Distribution
Example 2: A group of students surveyed 20 homes in a locality on the number of plants they have in their homes.
| Number of Plants | 0 - 2 | 2 - 4 | 4 - 6 | 6 - 8 | 8 - 10 | 10 - 12 | 12 - 14 |
| Number of Houses | 1 | 2 | 1 | 5 | 6 | 2 | 3 |
Find the mean number of plants per household using the assumed mean method of calculating mean.
Solution: The data is given as:
| No. of Plants | No.of Houses (fi) | Xi | di= xi - a | fidi |
|---|---|---|---|---|
| 0-2 | 1 | 1 | 1-7=-6 | -6 |
| 2-4 | 2 | 3 | 3-7=-4 | -8 |
| 4-6 | 1 | 5 | 5-7=-2 | -2 |
| 6-8 | 5 | 7=a | 7-7=0 | 0 |
| 8-10 | 6 | 9 | 9-7=2 | 12 |
| 10-12 | 2 | 11 | 11-7=9 | 18 |
| 12-14 | 3 | 13 | 13-7=6 | 18 |
| Total | Σfi =20 | Σfidi = 32 |
- We have taken 7 as the assumed mean here.
- Using the assumed mean method,
- Mean = a + (Σfidi / Σfi)
- 7 + (32 / 20)
- 7+ (8 / 5)
- 8.6
The required answer is 8.6.
Read More:
| Related Topics | ||
|---|---|---|
| Measures of Central Tendency | Graphical Representation of Data and Central Tendency | Mode of Grouped Data |
| Relation Between Mean Median and Mode | Mode Formula | Measures of Dispersion |
Things to Remember
- Mean is the average or central value of a set of numbers that is used to measure the central tendency of the data.
- There are three methods to calculate the mean of grouped data namely direct method, assumed mean method, and step-deviation method.
- Assumed Mean Method is used when data is large, and we can not use the direct method.
- Assumed Mean is calculated using the formula a + (Σfidi /Σfi).
- The method results in small numerical values that make the calculations easy for data sets with large values.
Sample Questions
Ques. The table depicts information about the percentage distribution of female employees in a company of various branches and a number of departments. Find the mean percentage of female employees using the assumed mean method. (3 Marks)
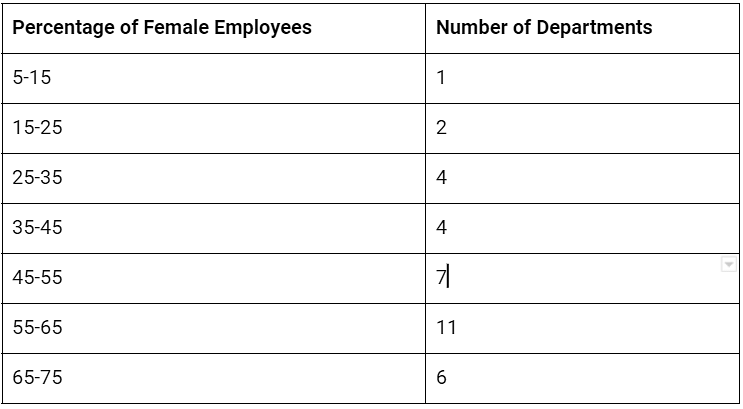
Solution: We will calculate the class mark and deviation as follows:
| Percentage of Female Employees | Number of Departments (fi) | Class Mark (xi) | di = xi – a | fidi |
|---|---|---|---|---|
| 5-15 | 1 | 10 | -30 | -30 |
| 15-25 | 2 | 20 | -20 | -40 |
| 25-35 | 4 | 30 | -10 | -40 |
| 35-45 | 4 | 40 = a | 0 | 0 |
| 45-55 | 7 | 50 | 10 | 70 |
| 55-65 | 11 | 60 | 20 | 220 |
| 65-75 | 6 | 70 | 30 | 180 |
| Total | Σfi =35 | Σfidi = 360 |
- Let the assumed mean = a = 40
- Using the Assumed Mean Method Formula,
- Mean = a + (Σfidi /Σfi)
- 40+ (360/35)
- 40+(72/7)
- 40 + 10.28
- 50.28
Therefore, the mean percentage of female employees is calculated as 50.28.
Ques. How do you define the assumed mean method? (2 Marks)
Ans. In statistics, the assumed mean is defined as a method that is used for calculating the arithmetic mean and standard deviation of a data set. It is used for the calculation of the mean for data with larger values or samples.
Ques. Calculate the mean of the following data using the assumed mean method. (3 Marks)

Ans. Using the data given above, we get
| Class Interval | (fi) | (xi) | di= xi - A | fidi |
|---|---|---|---|---|
| 0 - 10 | 12 | 5 | - 20 | - 240 |
| 10 - 20 | 15 | 15 | - 10 | - 150 |
| 20 - 30 | 10 | 25 (a) | 0 | 0 |
| 30 - 40 | 25 | 35 | 10 | 250 |
| 40 - 50 | 20 | 45 | 20 | 400 |
| Total | 82 | 260 |
- Here, the assumed mean is taken as 25.
- Using the Assumed Mean Method Formula,
- Mean = a+ (Σfidi /Σfi)
- 25 + 260/82
- 25 + 3.170
- 28.17.
Thus, the mean for the data is 28.17.
Ques. What are the different methods to calculate the mean of a given frequency? (3 Marks)
Ans. There are different methods to calculate the mean, however, the most prominent methods to calculate the mean are the direct method, assumed mean method, and step deviation method.
- The direct method is used for classes with small frequencies and class marks.
- The assumed mean method and step deviation method can be used for large data structures.
Ques. Find the arithmetic mean for the following data using the assumed mean method. (3 Marks)

Ans. Take the assumed mean A = 15
| xi | fi | di = x - A | fidi |
|---|---|---|---|
| 5 | 4 | -10 | -40 |
| 10 | 5 | -5 | -25 |
| 15 | 7 | 0 | 0 |
| 20 | 4 | 5 | 20 |
| 25 | 3 | 10 | 30 |
| 30 | 2 | 15 | 30 |
| Total | ∑fi = 25 | ∑fidi = 15 |
- Using the assumed mean method formula,
- Arithmetic mean = a + (Σfidi/Σfi)
- 15 + (15/25)
- 15 + (3/5)
- (75 + 3)/5
- 78/5
- 15.6
Thus, the arithmetic mean of the given data is 15.6.
Ques. What will be the mean for the following data? (3 Marks)

Ans. We will use the assumed mean method to solve the question. Let us take the assumed mean a = 80
| xi | fi | di = x - A | fidi |
|---|---|---|---|
| 65 | 6 | -15 | -90 |
| 70 | 11 | -10 | -110 |
| 75 | 3 | -5 | -15 |
| 80 | 5 | 0 | 0 |
| 85 | 4 | 5 | 20 |
| 90 | 7 | 10 | 70 |
| 95 | 10 | 15 | 150 |
| 100 | 4 | 20 | 80 |
| Total | ∑fi = 50 | ∑fidi = 115 |
- Arithmetic Mean = a+ (Σfidi /Σfi)
- 80 + (115/50)
- 80 + (23/10)
- 80 + 2.3
- 82.3
Hence, the mean for the given data is 82.3.
Ques. Given below is the data about the number of boys of a particular age in a class of 40 students. Calculate the mean age of the students in the class. (3 Marks)

Ans. Taking the assumed mean a = 16
| xi | fi | di = x - A | fidi |
|---|---|---|---|
| 13 | 3 | -3 | -9 |
| 14 | 8 | -2 | -16 |
| 15 | 9 | -1 | -9 |
| 16 | 11 | 0 | 0 |
| 17 | 6 | 1 | 6 |
| 18 | 3 | 2 | 6 |
| Total | ∑fi = 40 | ∑fidi = -22 |
- Mean = a+ (Σfidi /Σfi)
- 16 + (-22/40)
- 16 - 0.55
- 15.45
Thus, the mean age of the students is 15.45 years.
Ques. What will be the arithmetic mean of the following data? Use the assumed mean method to calculate the same. (3 Marks)

Ans. We will take the assumed mean as 45.
| xi | fi | di = x - A | fidi |
|---|---|---|---|
| 15 | 12 | -30 | -360 |
| 25 | 20 | -20 | -400 |
| 35 | 15 | -10 | -150 |
| 45 | 14 | 0 | 0 |
| 55 | 16 | 10 | 160 |
| 65 | 11 | 20 | 220 |
| 75 | 7 | 30 | 210 |
| 85 | 8 | 40 | 320 |
| Total | ∑fi = 103 | ∑fidi = 0 |
- Using the assumed mean method,
- Mean = a + (Σfidi /Σfi)
- Mean = 45 + (0/103)
- Mean = 45
Ques. What is the formula to calculate the mean through the assumed mean method? (3 Marks)
Ans. Mean through the assumed mean method is calculated by
Mean = a + (Σfidi /Σfi)
Here,
- a refers to the assumed mean.
- d refers to deviation (x – A).
- f refers to frequency.
In the assumed mean method, the data is given in the frequency distribution table. A value from the data is assumed as the mean value for calculation. On the basis of this assumed mean, the deviation is calculated by using d = x – A. Then we put all the values in the formula and compute it.
Ques. What is mean? (2 Marks)
Ans. Mean is one of the measures of central tendency along with the mode and median. Mean is the average of the given set of values. Mean denotes the equal distribution of values for a given data set or values. To calculate the mean, we need to add the total values and divide the sum by the total number of values.
Ques. The following table gives information about the marks obtained by 150 students in an examination. (3 marks)
| Class | 0-10 | 10-20 | 20-30 | 30-40 | 40-50 |
|---|---|---|---|---|---|
| Frequency | 10 | 20 | 30 | 40 | 50 |
Find the mean marks of the students using the assumed mean method.
Ans.| Class (CI) | Frequency (fi) | Class mark (xi) | di = xi – a | fidi |
|---|---|---|---|---|
| 0-10 | 10 | 5 | 5 – 25 = – 20 | -200 |
| 10-20 | 20 | 15 | 15 – 25 = – 10 | -200 |
| 20-30 | 30 | 25 = a | 25-25 = 0 | 0 |
| 30-40 | 40 | 35 | 35-25 = 10 | 400 |
| 40-50 | 50 | 45 | 45-25 = 20 | 1000 |
| Total | Σfi =150 | Σfidi = 1000 |
- Assumed mean = a = 25
- Mean of the data: a + ( Σfidi / Σfi)
- 25 + (1000 / 150)
- 25 + (6.67 )
- 31.66
Hence, the mean marks of the students are 31.66.
Ques. The following table shows the weight of 15 students. Calculate using Assumed Mean Method. (3 marks)
| Weight ( in kg ) | Number of students |
|---|---|
| 47 | 4 |
| 48 | 6 |
| 49 | 1 |
| 50 | 4 |
| 51 | 4 |
Ans. Let the assumed mean be A = 49
| Weight ( in kg ) xi | Number of students fi | di =xi −A =xi − 49 | fidi |
|---|---|---|---|
| 47 | 4 | -2 | -8 |
| 48 | 6 | -1 | -6 |
| 49 | 1 | 0 | 0 |
| 50 | 4 | 1 | 4 |
| 51 | 4 | 2 | 8 |
| – | ∑fi=19 | – | Σfidi = – 2 |
- Assumed mean = a = 49
- Mean of the data: a + ( Σfidi / Σfi)
- 49 + (- 2 / 19)
- 49 – 0.105
- 48.89
Hence, the mean weight of the students are 48.89.
Check-Out:



Comments