



Content Curator
Standard Deviation, in statistics, is the measuring of the variability in a particular statistical data. It can also be termed as measuring the dispersion of data. Variance and standard deviation are both part of statistics.
- Standard deviation, which is one of the basic methods of statistical analysis, is the positive square root of the variance.
- It is abbreviated as “S.D” and symbolised by 'σ’, which describes the value of how much it has deviated from the mean value.
- Finding the mean of the data is one of the most important factors while calculating the Standard Deviation.
Dispersion can be defined as the extent to which values in a distribution differ from the distribution average. In order to quantify the extent of variation, certain measures have to be followed. They are:
- Range
- Quartile Deviation
- Mean Deviation
- Standard Deviation
Read More: Probability Important Questions
Key Terms: Standard Deviation, Mean, Median, Mode, Statistics, Probability Distribution, Central Tendency, Random Variable, Data Set
What is Standard Deviation?
[Click Here for Sample Questions]
Standard deviation is the degree of dispersion. In descriptive statistics, it is the scatter of the data points relative to its mean.
- It represents the way in which the values are spread across the data sample.
- It is the measure of the variation of the data points from the mean.
- The standard deviation of a sample is therefore the square root of its variance, random variable, statistical population, data set, or probability distribution.
- When the data is in dispersion, or in scattered format and computing the central tendencies becomes difficult, we take the help of some dispersion methods.
There are four dispersion methods to calculate the central tendencies:
- Range
- Quartile Deviation
- Mean Deviation
- Standard Deviation
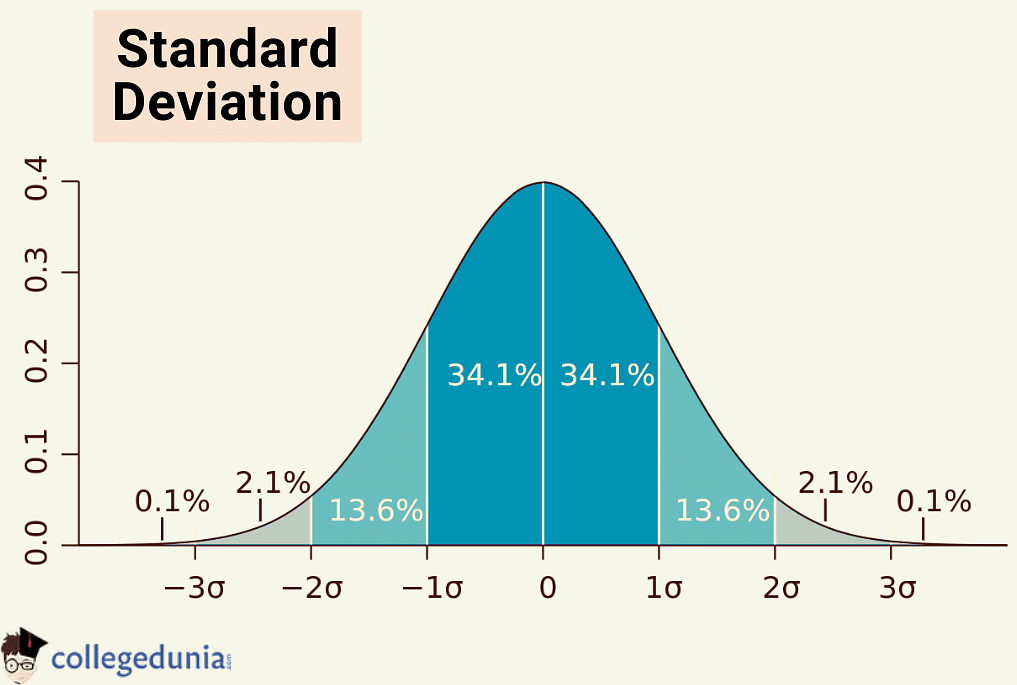
Standard Deviation, or SD, is called the dispersion measured from the data via its mean. It can also be considered as how much a value or a group differs from the mean or average. Therefore, as Standard Deviation measures the variability of the data, it is numerically the positive square root of ‘Variance.’ Standard Deviation is denoted by σ. Variance is denoted by (σ)2.
Read More: NCERT Solutions For Class 12 Mathematics Probability
Standard Deviation Example
Assume a number of gold coins 5 pirates own; 4, 2, 5, 8, 6.
Thus,
Mean: \(\begin{array}{l}\bar{x} = \frac{\sum x}{n}\end{array}\)
= \(\begin{array}{l}=\frac{x_1+x_2+x_3+x_4…..+x_n}{n}\end{array}\)
= (4 + 2 + 5 + 6 + 8) / 5
= 5
\(\begin{array}{l}x_n -\bar{x}\end{array}\) for each value of the sample:
= \(\begin{array}{l}x_1 -\bar{x} = 4 – 5 = -1\end{array}\)
= \(\begin{array}{l}x_2 -\bar{x} = 2 – 5 = -3\end{array}\)
= \(\begin{array}{l}x_3 -\bar{x} = 5 – 5 = 0\end{array}\)
= \(\begin{array}{l}x_4 -\bar{x} = 8 – 5 = 3\end{array}\)
= \(\begin{array}{l}x_5 -\bar{x} = 6 – 5 = 1\end{array}\)
Therefore,
\(\begin{array}{l}\sum \left ( x_n-\bar{x} \right )^2\end{array}\)
= \(\begin{array}{l}= (x_1 -\bar{x})^{2} + (x_2 -\bar{x})^{2}+ … +(x_5 -\bar{x})^{2}\end{array}\)
= (- 1)2 + (- 3)2 + 02 + 32 + 12
= 20
And for Standard Deviation, we have:
\(\begin{array}{l}S.D = \sqrt{\frac{\sum (x_n-\bar{x})^2}{n-1}}\end{array}\)
= \(\begin{array}{l}=\sqrt{\frac{20}{4}}\end{array}\)
= √5 = 2.236
Also Read:
| Concept-Related Topics | ||
|---|---|---|
| Chi-Square Formula | T-Test Formula | Standard Error Formula |
| Skewness Formula | Median | Coefficient of Variation Formula |
What is Variance?
[Click Here for Previous Year Questions]
Variance can be defined as the:
| “The measure of a data collection has been spread out.” |
- In case the data values are identical to one another, then the variance is zero. Herein, all the non-zero variances are positive.
- A little variance indicated that the data points are close to the mean, as well as to one another.
- However, in case the data points are highly spread from the mean and from each other, then it represents a high variance.
- Variance can be expressed as the average of the squared distance from every point to the mean.
Variance Formula
The Population Variance Formula can be represented by:
| \(\begin{array}{l}\sigma^2 =\frac{1}{N}\sum_{i=1}^{N}(X_i-\mu)^2\end{array}\) |
The Sample Variance Formula can be represented by:
| \(\begin{array}{l}s^2 =\frac{1}{n-1}\sum_{i=1}^{n}(x_i-\overline{x})^2\end{array}\) |
Read More: Venn Diagrams
Types of Standard Deviation
[Click Here for Sample Questions]
Standard deviation is broadly calculated in two ways based on the frequency distribution of the dataset presented:-
Standard Deviation for Discrete Frequency distribution
When there is no continuity in the elements of the data presented. There are no observation groups and a particular frequency value is allotted to each element.
Example: Given is a set of data. See that the elements are not grouped and a particular value of ‘f’ is given to each ‘x’.
| x | 5 | 21 | 11 | 18 | 46 | 30 |
|---|---|---|---|---|---|---|
| f | 4 | 6 | 8 | 2 | 5 | 3 |
Standard Deviation for Continuous Frequency distribution
Here, the elements or observations come in continuity or grouped format when the data is presented. It means that instead of a particular value being provided to each frequency, a ‘class’ or 'group’ of a certain element range is given.
Example: Given is a set of data. See that the observations are grouped or presented in a ‘class’ this time. Each ‘f’ is allotted a class.
| Class | 10-20 | 20-30 | 30-40 | 40-50 | 50-60 | 60-70 |
|---|---|---|---|---|---|---|
| f | 3 | 5 | 13 | 14 | 8 | 11 |
Standard Deviation Formula
[Click Here for Previous Year Questions]
There are two formulas or two ways of calculating the standard deviation. Thus, the many S.D Formula includes:
Population Standard Deviation
The Population Standard Deviation formula is:
| \(\sigma = \sqrt{\frac{\Sigma(x_i - \mu)^2}{N}}\) |
Here,
- σ = standard deviation
- N = no. of observations
- Xi = observations of data
- μ = mean of data
Sample Standard Deviation
The Sample Standard Deviation Formula is:
| \(s= \sqrt{\frac{\Sigma_{i=1}^N(x_i - \overline{x})^2}{N -1}}\) |
Here,
- s = standard deviation
- N = number of observations
- Xi = value of samples
- X with bar = mean of the samples
Calculation of Standard Deviation
[Click Here for Sample Questions]
In order to calculate SD, we will have to find the Variance of the data.
For Finding the Variance and Standard Deviation of Discrete Data
Follow the steps to find the Variance and SD of discrete frequency distribution data:
- Step 1: Make 6 tabular columns.
- Step 2: In column 1, all the values of xi (elements or observations of the dataset) will be represented while column 2 will have fi (frequency allotted to each element of the dataset).
- Step 3: In column 3, xi multiplied by fi will be represented (all the values of xi have to be multiplied with their respective fi).
- Step 4: Find the mean of the data (to find the mean or average, the summation of xifi has to be divided by the summation of frequencies).
- Step 5: In column 4, the mean has to be subtracted from every value of xi (xi - mean). Then, in column 5, write the square of all these values obtained.
- Step 6: In column 6, multiply the corresponding fi with the squared values of (xi - mean).
- Step 7: Apply the formula to find the variance [take summation of the fi (xi - mean)2 and then divide it by the number of observations].
- Step 8: Take the positive square root of the variance obtained to find the standard deviation.
For Finding the Variance and Standard Deviation of Grouped Data
To find the standard deviation formula for grouped data, follow the given steps to find the variance and standard deviation formula of data with class:
- Step 1: Make 7 Columns
- Step 2: In the first column keep the class. In the second column keep the fi (frequency)
- Step 3: In the 3rd column, take the midpoint of the class and make the xi column.
- Step 4: Find the mean of the data (to find the mean or average, the summation of xifi has to be divided by the summation of frequencies).
- Step 5: In column 4, the mean has to be subtracted from every value of xi (xi - mean). Then, in column 5, write the square of all these values obtained
- Step 6: In column 6, multiply the corresponding fi with the squared values of (xi - mean).
- Step 7: Apply the formula to find the variance [take summation of the fi (xi - mean)2 and then divide it by the number of observations].
- Step 8: Take the positive square root of the variance obtained to find the standard deviation.
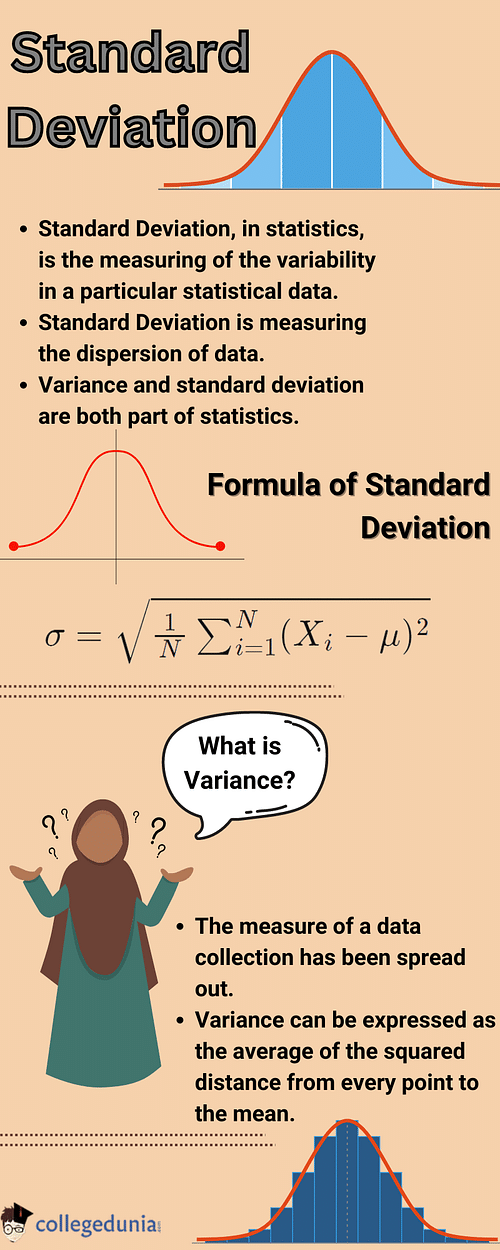
Standard Deviation Infograph
Read Also: Frequency Distribution Table
Standard Deviation of Ungrouped Data
[Click Here for Previous Year Questions]
The calculations for standard deviation are known to differ for different data. There are two methods to determine the standard deviation.
- Actual Mean Method
- Assumed Mean Method
Standard Deviation by The Actual Mean Method
The Actual Mean Method formula can be denoted as: σ = √(∑\(x-\bar x) \)2 /n).
Assume the data observations 3, 2, 5, 6.
For these, the mean of the data points is 16/4 = 4.
The squared differences from mean = (4-3)2+(2-4)2 +(5-4)2 +(6-4)2 = 10
In case of Variance = Squared differences from mean/number of data points
= 10/4
= 2.5
And, for Standard deviation = √2.5
= 1.58
Standard deviation by Assumed Mean Method
An arbitrary value (A) is selected as the mean when the x values are large. The deviation from this assumed mean, d = x - A.
Also Read: Uniform Distribution Formula
Standard Deviation of Random Variables
[Click Here for Sample Questions]
The measure of spread for the probability distribution of a random variable helps to find the degree to which the values differ from the expected value. It can be further denoted by X, Y, or Z, since it is a function.
- In case X is a random variable, the standard deviation can be calculated by assuming the square root of the sum of the product of the squared difference between the random variable, x, alongside the expected value (\(\mu\)) as well as the probability-associated value of the random variable.
- The standard deviation of the probability distribution of X, can be shown as \(\sigma\) = \(\sqrt{(x - \mu)^2 P(X=x)} \)
- It is also equal to \(\sigma\) = \(\sqrt{E(X)^2-[E(X)]^2} \)
Read Also: Exponential Distribution
Standard Deviation of Probability Distribution
[Click Here for Previous Year Questions]
The experimental probability has several trials. When the difference between the theoretical probability of an event along with its relative frequency comes closer to one another, the average outcome is known. This mean is referred to as the expected value of the experiment and can be indicated by \(\mu\).
- In the case of a normal distribution, the mean is zero and the standard deviation is 1.
- In the case of a binomial experiment, the number of successes is a random variable. Considering that a random variable has binomial distribution, then its standard deviation can be represented by: \(\sigma\) = √npq (here, mean: \(\mu\) = np, n = number of trials, p = probability of success and 1 – p = q is the failure probability).
- In the case of Poisson distribution, the standard deviation can be denoted by \(\sigma\) = √λt, (where λ = average number of successes in an interval of time t).
Things to Remember
- Standard deviation can be defined as the positive square root of the variance.
- Dispersion can be expressed as the extent to which values in a distribution differ from the distribution average.
- Variance is the average of the squared distance from every point to the mean.
- The formula of Population Standard Deviation is \(\sigma = \sqrt{\frac{\Sigma(x_i - \mu)^2}{N}}\).
- The formula of Sample Standard Deviation is \(s= \sqrt{\frac{\Sigma_{i=1}^N(x_i - \overline{x})^2}{N -1}}\).
- The formula of Actual Mean Method is σ = √(∑\(x-\bar x) \)2 /n).
Read More: Difference between Sequence and Series
Previous Year Questions
- Two cards are drawn at random from a pack of 52 cards ….[KCET 2016]
- Probability of four sons to a couple is…..[NEET 2001]
- An unbiased coin is tossed 5 times. Suppose that a variable X… (JEE Main 2020)
- The probability that an event A happens in one trial of an experiment… (JEE Advanced 1980)
- If two dice are thrown simultaneously, then the probability that the sum of the numbers ….[KCET 2015]
- A die is thrown twice. If getting a number greater than four on the die is..[MHT CET 2019]
- A bag contains (2n+1) coins. It is known that n of these coins have a head on ….[KCET 2015]
- A and B each select one number at random from the distinct numbers 1,2,3 ...[WBJEE 2019]
- Two dice are thrown simultaneously, the probability of ….[KCET 2016]
- A bag contains 2n coins out of which n−1n−1 are unfair with ….[BITSAT 2019]
Sample Questions
Ques: Find the variance of the following dataset: 3,4,5,6,7,10 (3 marks)
Ans: Mean = (3 + 4 + 5 + 6 + 7 + 10)/6 = 5.82

(7.95 + 3.31 + 0.67 + 0.032 + 0.032 + 17.47)/6 = 4.91
Ques: The mean of a set of 6 observations is 6 while the standard deviation is 4. If each sample is multiplied by 3, what is the new mean and standard deviation? (3 marks)
Ans: Let the number observations be x1, x2, x3, x4, x5, and x6.
Mean of the observation (original) is 8. Hence, as per the formula =

Now, from the formula of variance we know that, variance =

Therefore, substitute the values
Variance = (standard deviation)2 = (4)2

(16 + 64) = (x12 + x22 + x32 + x42 + x52 + x62) /6
(80) x 6 = x12 + x22 + x32 + x42 + x52 + x62 = 480
Now, as each observation has to be multiplied by 3, the new list of observations are:

Now, the new SD will be produced as such:-

= 144.
The variance, therefore, is 12.
Ques: Find the value of the mean, variance and Standard deviation for the following tabulated data: (4 marks)

Ans: As per the table, the following can be shown:

Thus, SD = 6.587.
Ques: The following data shows the study hours of students for a week. Compute the mean, variance and standard deviation of the following data using the shortcut method. (4 marks)

Ans: Let the assumed mean be, a = 25

Ques: If there exist 18 items according to the statement, Σ (x -5)= 3,Σ (x -5)2= 43, then find the mean as well as the standard deviation of the given dataset. (2 marks)
Ans: n = 18 = no. of observations. Now, according to the assumed mean method:

Ques: Calculate the Standard deviation of the first ‘n’ natural numbers. (3 marks)
Ans: It can be shown that:

Ques: What is the standard deviation of the data given below? (3 marks)

Ans: The standard deviation of the data can be shown as:

Ques: While noting 10 observations, it is found that the mean and variance calculated as 45 and 16 respectively are wrong because the number 25 was taken as 52. Find the correct mean, variance and standard deviation (4 marks).
Ans: Thus,

Standard deviation = 6.62 (corrected).
Ques: Determine the mean, variance and standard deviation of the following data. (5 marks)

Ans: As per the question, the data can be shown as:
| Class Interval | Frequency (f) | Mid Value (xi) | fxi | fxi2 |
|---|---|---|---|---|
| 0 – 10 | 27 | 5 | 135 | 675 |
| 10 – 20 | 10 | 15 | 150 | 2250 |
| 20 – 30 | 7 | 25 | 175 | 4375 |
| 30 – 40 | 5 | 35 | 175 | 6125 |
| 40 – 50 | 4 | 45 | 180 | 8100 |
| 50 – 60 | 2 | 55 | 110 | 6050 |
| - | ∑f = 55 | - | ∑fxi = 925 | ∑fxi2 = 27575 |
Thus, it can be said that, N = ∑f = 55
Now, in case of Mean = (∑fxi)/N
= 925/55
= 16.818
In case of Variance = 1/(N – 1) [∑fxi2 – 1/N(∑fxi)2]
= 1/(55 – 1) [27575 – (1/55) (925)2]
= (1/54) [27575 – 15556.8182]
= 222.559
And for Standard deviation = √variance
= √222.559
= 14.918
Ques: 39 plants have been planted in a garden. Some of the plants were randomly selected and their heights (cm) were recorded: 51, 38, 79, 46, 57. Thus, evaluate the standard deviation of their heights. (2 marks)
Ans: As per the given question, N = 5
= Mean (\(\bar{x}\)) = (51 + 38 + 79 + 46 + 57)/5 = 54.2
Standard Deviation = \(\sqrt{\dfrac{\Sigma (x_i-\bar{x})^2}{N-1}} \) = 15.5
Read More:



Comments