



Education Content Expert
Variance Formula measures how far a set of numbers are spread out in Statistics and probability theory. Variance is a statistical measurement that is used to indicate how widely individuals vary within a group. If individual observations differ significantly from the group mean, the variance is large and vice versa. The variance formula for the ungrouped data and the grouped data is different.
A variance of zero indicates that all the values are equal (identical). It must be noted that variance is always non-negative. A small variance indicates that the data points are very close to the mean and, therefore, close to each other, while a high variance indicates that the data points are widely spread around the mean and from each other.
Read More: NCERT Solutions For Class 11 Maths Statistics
| Table of Content |
Key Terms: Variance, Variance Formula, Population Variance, Sample Variance, Standard Deviation, Dispersion, Grouped Data, Ungrouped Data
What is Variance?
[Click Here for Sample Questions]
Variance is a measure of dispersion that is used to measure how far a set of numbers is spread. It is a quantity that is used to check the variability of data about an average value. The data can be of two types namely grouped and ungrouped. The data expressed in the form of class intervals is grouped data while the data consisting of individual data points is called ungrouped data.
There are two types of variance:
- Population Variance
- Sample Variance
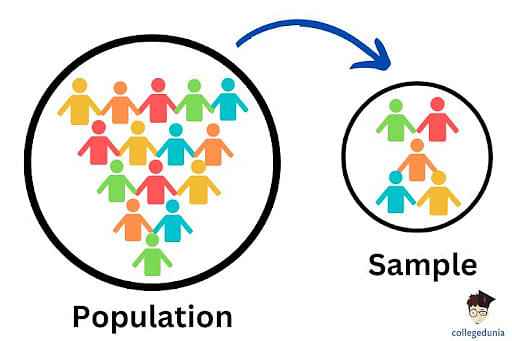
Population and Sample
Population Variance
- A population means all the members of a particular group.
- When we want to find out how each data point in a given population varies or is spread out then we use the population variance.
- Population variance is used to give the squared distance of each data point from the population mean.
Sample Variance
- A sample is a portion of the population used to describe the entire group.
- It is used in case the size of the population is too large then it is difficult to take each data point into consideration.
- The sample variance is defined as the average of the squared distances from the mean. The variance is calculated with respect to the sample mean.
Read More:
Variance Formula
[Click Here for Previous Year Questions]
The variance is calculated for either grouped or ungrouped data. Variance can be of two types which are:
- Variance of a Population
- Variance of a Sample
The variance of a population is denoted by σ2, while the variance of a sample is denoted by s2.
Read More: Population & Sample
Variance Formulas for Ungrouped Data
[Click Here for Sample Questions]
The variance formula for ungrouped data is as follows:
Population Variance
σ2 = \(\frac{1}{N} \sum _{i=1}^N (x_i - \mu)^2\)
Where
- σ2 = Variance
- xi = ith observation of given data
- μ = Population mean
- N = Size of Population or Total number of observations
Sample Variance
S2 = \(\frac{1}{n-1} \sum _{i=1}^N (x_i - \bar{x})^2\)
Where
- s2 = Sample variance
- xi = ith observation of given data
- x̄ = Sample mean
- n = Size of Sample or Total number of data values taken in sample
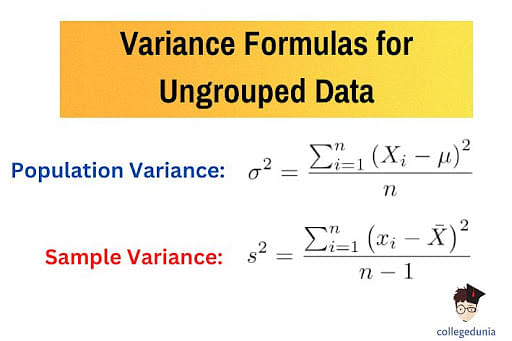
Variance Formulas for Ungrouped Data
Read More: Statistics Important Questions
Variance Formulas for Grouped Data
[Click Here for Previous Year Questions]
The variance formula for grouped data is:
Formula for Population Variance
The formula of population variance for grouped data is:
σ2 = ∑ f (m − x̄)2 / n
Formula for Sample Variance
The formula for sample variance for grouped data is: s2 = ∑ f (m − x̄)2 / n − 1
Where
- f = frequency of the class
- m = midpoint of the class
The formulas of population variance and sample variance can also be written as:
Population Variance
σ2= \(\frac{1}{N}[ \sum _{i=1}^N f_ix_i^2-(\frac{ \sum _{i=1}^N f_ix_i^2}{N})^2]\)
Where
- σ2 = Variance
- xi = Midvalue of ith class
- fi = Frequency of ith class
- N = Size of Population or Total number of observations
Sample Variance
S2 = \(\frac{1}{n-1}[ \sum _{i=1}^N f_ix_i^2-(\frac{ \sum _{i=1}^N f_ix_i^2}{n})^2]\)
Where
- s2 = Sample variance
- xi = Midvalue of ith class
- fi = Frequency of ith class
- n = Size of Sample or Total number of data values taken in sample
Read More: Statistics MCQ
Variance Formula Solved Examples
[Click Here for Sample Questions]
Example 1: Calculate the variance for the given data:
| Class Intervals | Frequency |
|---|---|
| 200 – 201 | 13 |
| 201 – 202 | 27 |
| 202 – 203 | 18 |
| 203 – 204 | 10 |
| 204 – 205 | 1 |
| 205 – 206 | 1 |
Solution: The variance will be calculated as:
| CI | fi | xi | fixi | fixi2 |
|---|---|---|---|---|
| 200 – 201 | 13 | 200.5 | 2606.5 | 522603.25 |
| 201 – 202 | 27 | 201.5 | 5440.5 | 1096260.75 |
| 202 – 203 | 18 | 202.5 | 3645 | 738112.5 |
| 203 – 204 | 10 | 203.5 | 2035 | 414122.5 |
| 204 – 205 | 1 | 204.5 | 204.5 | 41820.25 |
| 205 – 206 | 1 | 205.5 | 205.5 | 42230.25 |
| ∑fi = 70 | ∑fixi = 14137 | ∑fixi2 = 2855149.5 |
s2 = \(\frac{1}{n-1}[ \sum _{i=1}^N f_ix_i^2-(\frac{ \sum _{i=1}^N f_ix_i^2}{n})^2]\)
= [1/ (70 – 1)] [2855149.5 – (1/70) (14137)2]
= 1.179
Example 2: Calculate the variance for the following set of data representing the heights of some trees in feet: 3, 21, 98, 203, 17, 9
Solution: To calculate the variance, we will follow the given steps:
Step 1: Find the sum of all the values in the given data set.
3 + 21 + 98 + 203 + 17 + 9 = 351
Step 2: Now, square the value received.
351 × 351 = 123201
Divide the obtained value by the number of items, such that
123201/6 = 20533.5
Step 3: Take up the original numbers from Step 1 and square them individually.
3 × 3 + 21 × 21 + 98 × 98 + 203 × 203 + 17 × 17 + 9 × 9
Now, add up the squares together
9 + 441 + 9604 + 41209 + 289 + 81 = 51,633
Step 4: Subtract the value in Step 2 from the value in Step 3.
51633 – 20533.5 = 31,099.5
Step 5: Now, subtract 1 from the number of items in your data set.
6 – 1 = 5
Step 6: Divide the value obtained in Step 4 by the value in Step 5.
31099.5/5 = 6219.9
Thus, the variance of the given data set is 6219.9.
Properties of Variance
[Click Here for Previous Year Questions]
Following are some properties that can help in solving both simple and complex sum problems:
- If the variance is zero, it indicates that all the data points in the data set have equal value.
- If the variance is large, it means that the data is more vastly spread out from the mean. Also, a small variance is a sign that the data point values are close to one another as well as clustered around the mean.
- Var (X + C) = Var(X), where X is a random variable and C is a constant.
- Var (aX + b) = a2.Var(X), where a and b are constants.
- Var (CX) = C2.Var(X), where C is a constant.
- Var (X1 + X2 +……+ Xn) = Var(X1) + Var(X2) +……. +Var (Xn) (where X1, X2… Xn are random and independent variables.)
Read More:
| Related Topics | ||
|---|---|---|
| Central Limit Theorem | Mean Absolute Deviation | Root Mean Square |
| Statistics Formulas | Average Deviation Formula | Square Root Formula |
Relationship between Variance and Standard Deviation
[Click Here for Sample Questions]
The relationship between variance and standard deviation for a sample data set is shown below:
- Variance estimates the average squared deviations from the mean value of data, while standard deviation estimates the square root of that value.
- Both the variance and the standard deviation estimate variability in a distribution.
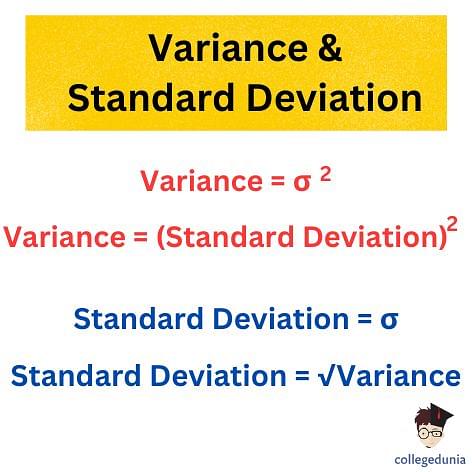
Variance and Standard Deviation
- The standard deviation has the same units as the original values, such as minutes or meters, while the variance has much larger units, like meters squared.
- The variance will have an equal value to the square of the standard deviation, or the standard deviation can be referred to as the square root of the variance.
Variance = Square of Standard Deviation
V = σ2
Here
- V stands for variance.
- σ stands for standard deviation.
Things to Remember
- Variance is a measure of dispersion that is used to check the variability of data about an average value.
- Variance can be of grouped data or ungrouped data.
- The two types of variance are population variance and sample variance.
- The variance of a population is denoted by σ2, while the variance of a sample is denoted by s2.
- Population Variance for Ungrouped Data: σ2 =\(\frac{1}{N} \sum _{i=1}^N (x_i - \mu)^2\)
- Sample Variance for Ungrouped Data:s2 = \(\frac{1}{n-1} \sum _{i=1}^N (x_i - \bar{x})^2\)
- Population Variance for Grouped Data:σ2 = \(\frac{1}{N}[ \sum _{i=1}^N f_ix_i^2-(\frac{ \sum _{i=1}^N f_ix_i^2}{N})^2]\)
- Sample Variance for Grouped Data:s2 = \(\frac{1}{n-1}[ \sum _{i=1}^N f_ix_i^2-(\frac{ \sum _{i=1}^N f_ix_i^2}{n})^2]\)
Previous Years’ Questions (PYQs)
- The variance of the first 50 even natural numbers is… (JEE Main 2014)
- The variance of the first 20 natural numbers is…
- The mean of 5 observations is 5 and their variance is 124. If three… (JEE Main 2016)
- If the mean and the variance of a binomial variate… (JEE Main 2015)
- The variance of first n even natural numbers is… (JEE Main 2009)
- A measure of dispersion is indicative of the reliability…
- The mean and variance of 7 observations are 8 and…
- The mean and variance of 20 observations are found to… (JEE Main 2020)
- The variance of the numbers 2, 3, 11 and x is…
- The mean and standard deviation of marks obtained…
Sample Questions
Ques. Compute the variance and standard deviation for the following information: (3 Marks)

Ans. From the provided information, the following table can be generated:
| xi | fi | fixi | xi- x | (xi- x)2 | fi(xi- x)2 |
|---|---|---|---|---|---|
| 4 | 3 | 12 | -10 | 100 | 300 |
| 8 | 5 | 40 | -6 | 36 | 180 |
| 11 | 9 | 99 | -3 | 9 | 81 |
| 17 | 5 | 85 | 3 | 9 | 45 |
| 20 | 4 | 80 | 6 | 36 | 144 |
| 24 | 3 | 72 | 10 | 100 | 300 |
| 32 | 1 | 32 | 18 | 324 | 324 |
| 30 | 420 | 1374 |
Mean:
Mean (\(\bar {x}\)) = \(\frac{ \sum f_ix_i}{\sum f_i}\)
420/30 = 40
Variance:
σ2= \(\frac{\sum f_i(X_i - \bar{X})^2}{N}\)
1374/30 = 45.8
Standard Deviation = √Variance = √45.8 = 6.77
Ques. Compute the mean and variance for the following information: (3 Marks)

Ans. From the provided information, the following table can be generated:
| Class | Frequency (fi) | Mid-value (xi) | fixi | (xi – x)2 | fi(xi – x)2 |
|---|---|---|---|---|---|
| 30-40 | 3 | 35 | 105 | 729 | 2187 |
| 40-50 | 7 | 45 | 315 | 289 | 2023 |
| 50-60 | 12 | 55 | 660 | 49 | 588 |
| 60-70 | 15 | 65 | 975 | 9 | 135 |
| 70-80 | 8 | 75 | 600 | 169 | 1352 |
| 80-90 | 3 | 85 | 255 | 529 | 1587 |
| 90-100 | 2 | 95 | 190 | 1089 | 2178 |
| 50 | 3100 | 10050 |
Thus,
Mean:
\(\bar{X} = \frac{\sum Fx}{\sum F}\)
= 3100/50 = 62
Variance:
σ2= \(\frac{\sum F(X - \bar{X})^2}{\sum F}\)
= 100050/50 = 201
σ = 14.17
Ques. Find the variance of the numbers 3, 8, 6, 10, 12, 9, 11, 10, 12, and 7. (3 Marks)
Ans. X= 3+8+6+10+12+9+11+10+12+710
= 8810
= 8.8
| Value (X) | X–X | (X–X)2 |
|---|---|---|
| 3 | -5.8 | 33.64 |
| 8 | -0.8 | 0.64 |
| 6 | -2.8 | 7.84 |
| 10 | 1.2 | 1.44 |
| 12 | 3.2 | 10.24 |
| 9 | 0.2 | 0.04 |
| 11 | 2.2 | 4.84 |
| 10 | 1.2 | 1.44 |
| 12 | 3.2 | 10.24 |
| 7 | -1.8 | 3.24 |
| Total | 0 | 73.6 |
Population Variance = 73.610
= 7.36
Ques. Given the following population data, find its population variance. (3 Marks)

Ans. Population Mean = (30+42+37+16+31+28+33+41+12)/9 = 2709 = 30
Using the population variance formula,
Population Variance = (21-30)2+ (42-30)2+ (37-30)2+ (16-30)2+ (31-30)2+ (28-30)2+ (33-30)2+ (41-30)2+ (12-30)2/9
= 929/9 = 103.22 units2
Thus, the population variance of the given dataset is 103.22.
Ques. What do you mean by variance? (3 Marks)
Ans. Variance refers to a measure of how data points differ from the mean. It is a measure of how far a set of data (numbers) are spread out from their mean (average) value. It helps us to find the expected difference of deviation from the actual value. Thus, the variance depends on the standard deviation of the given data set.
The more the value of variance, the more data is scattered from its mean. And if the value of variance is low or minimum, then it is less scattered from the mean. Therefore, variance is also referred to as a measure of the spread of data from the mean.
Ques. State the difference between the Variance and Standard Deviation. (2 Marks)
Ans. Variance is the average squared deviation from the mean, while standard deviation is the square root of the variance. Both measures give thought to variability in distribution, but their units vary: Standard deviation is expressed in the same units as the original values (For example, minutes or meters).
Ques. Which is better to use Variance Formula or Standard Deviation Formula? (2 Marks)
Ans. They each have different purposes. The Standard deviation is generally more useful for describing the variability of the data while the variance is generally more useful mathematically. For example, the addition of uncorrelated distributions (random variables) also has a variance that is the addition of the variances of those distributions.
Ques. How do I calculate the variance using the Variance Formula? (3 Marks)
Ans. The variance can be calculated by following the steps given below:
- Step 1: Find the mean of the data set. Make a total of all data values and divide them by the sample size n.
- Step 2: Find the squared difference from each data value's mean (average). Deduct the mean from each data value and square the resulting figure.
- Step 3: Make a total of all the squared differences.
- Step 4: Calculate the variance. Population Variance for population of size N = (xi-x)2N
Ques. Find the variance for the following set of data representing tree heights in feet: 3, 21, 98, 103, 17, 9. Explain the step-by-step procedure for finding the variance. (5 Marks)
Ans. The step-by-step procedure for calculating variance is as under:
- Step 1: Make a total of the numbers in the given data set: 3 + 21 + 98 + 113 + 17 + 9 = 261
- Step 2: Square the number resulting from the total of the numbers: 261 × 261 = 68121
- Step 3: Divide the squared number by the number of items: 68121/6 = 11353.5
- Step 4: Take the original numbers from Step 1, and square them individually: 3 × 3 + 21 × 21 + 98 × 98 + 113 × 113 + 17 × 17 + 9 × 9
- Step 5: Make a total of the squares together: 9 + 441 + 9604 + 12769 + 289 + 81 = 23,193
- Step 6: Deduct the amount of Step 3 from the amount of Step 5: 23193 – 11353.5 = 11,839.5. Set this number aside for a moment.
- Step 7: Deduct 1 from the total number of items in your data set: 6 – 1 = 5
- Step 8: Divide the number of Step 6 by the number of Step 7, which will give you the variance: 11839.5/5 = 2367.9
- Step 9: Take the square root of your number of Step 6, which will give you the standard deviation: √2367.9 = 48.66107
Thus, the answer is 48.66.
Ques. What will be the sample variance of the data (3, 4, 7, 12, 14)? (3 Marks)
Ans. Given that,
n = 5
Mean = (3 + 4 + 7 + 12 + 14) / 5 = 8
Sample variance = \(\sum = \frac{(X_i - \bar{X})^2}{N-1}\)
[(3 - 8)2 + (4 - 8)2 + (7 - 8)2 + (12 - 8)2 + (14 - 8)2) / 5 - 1 = 23.5Thus, the variance is 23.5.
Check-More:



Comments