



Content Curator
The interquartile range is the difference between the third and first quartiles. Quartiles are partitioned values that divide an entire series into four equal parts. So there are three quartiles.
- The first quartile is marked by Q1, also known as the lower quartile.
- The second quartile is denoted by Q2, and the third quartile is represented by Q3, known as the upper quartile.
- Hence, the interquartile range equals the difference between the upper and lower quartiles.
- The interquartile range (IQR) is used to identify and eliminate deviation from a series of data at both ends.
- It is a measure of variability that is calculated by categorizing a data set into quartiles like first, second, third, and fourth.
| Table of Content |
Key Terms: Interquartile range, Data collection, Range, Statistics, Data set, Median, Data points. Quartile, First Quartile, Mean, Third Quartile, Ordered set
What is Interquartile Range Formula?
[Click Here for Sample Questions]
The Interquartile Range (IQR) formula calculates the middle 50% of a data collection. The Interquartile Range is the smallest of all statistical measures of dispersion.
- The interquartile range is the difference between the upper and lower quartiles.
- This can be used to calculate the difference between the third and first quartiles.
- It calculates variability by splitting an ordered set of data into quartiles.
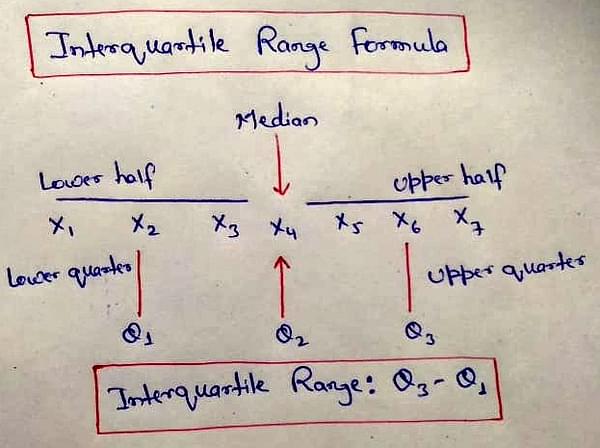
- The First Quartile or Q1 gives the middle value in the first half of the data set.
- The second Quartile or Q2 gives the median of the data set.
- The third Quartile or Q3 gives the middle value in the second half of the data set.
Also Read:
Formula of Interquartile Range
[Click Here for Sample Questions]
The Interquartile Range (IQR) formula can be represented as,
\(IQR = Q_3 - Q_1\)
Where,
- IQR is the Inter-quartile range
- Q1 is the First quartile
- Q3 is the Third quartile
The First Quartile, Q1 can also be found by using the following formula
\(\large Q_{1}=\left(\frac{n+1}{4}\right)^{th}term\)
The Third Quartile, Q3 can also be found by using the following formula
\(\large Q_{3}=\left(\frac{3(n+1)}{4}\right)^{th}term\)
In the above cases, if the values are not whole numbers, we must round them to the nearest integer.
How to Find Interquartile Range?
[Click Here for Sample Questions]
Interquartile Range (IQR) of a given set of data can be determined using some simple steps which are mentioned below:
- Step 1: Arrange the given values in ascending order.
- Step 2: The Second Quartile or Q2 is the median of the given values. The middle term is (n+1)/2 if the number of values is odd, while the median is the mean of the two middle points if the number of values is even.
- Step 3: First Quartile or Q1 is the median of the values present to the left of the median calculated in Step 2.
- Step 4: The third Quartile or Q3 is the median of the values present to the right of the median calculated in Step 2.
- Step 5: Now we have all the required values, we can calculate IQR = Q3 - Q1.
Solved Examples
[Click Here for Sample Questions]
Ques. Calculate the range of the following set of data: {4, 17, 7, 14, 18, 12, 3, 16, 10, 4, 4, 11}, using the interquartile range formula
Ans. Given
- Number of terms = 12
- Set = {4, 17, 7, 14, 18, 12, 3, 16, 10, 4, 4, 11}
- Ordered set = {3, 4, 4, 4, 7, 10, 11, 12, 14, 16, 17, 18}
Now divide the set into quartiles and each quarter will have 3 terms:
{3, 4, 4}, {4, 7, 10}, {11, 12, 14}, and {16, 17, 18}
The First Quartile is given by,
Q1 = (4 + 4)/ 2 = 4
The Third Quartile is given by
Q3 = (14 + 16)/2 = 15
Using the Interquartile Range Formula, we get
Q2 = Q3 – Q1
⇒ Q2 = 15 – 4 = 11
Therefore, the Interquartile range of the given set = 11
Ques. Find the interquartile range for the first ten odd numbers: 1, 3, 5, 7, 9, 11, 13, 15, 17, 19.
Ans. Given, the total number of terms n = 10.
The formula of the median is given by
Median = \(\frac{(\frac{n}{2})^{th}term + (\frac{n}{2}+1)^{th}term}{2}\)
⇒ Median = \(\frac{9 + 11}{2} = 10\)
Therefore, the set of data is divided into two parts: 1, 3, 5, 7, 9 and 11, 13, 15, 17, 19
- Q1 is the Median of the first part = 5
- Q3 is the Median of the second part = 15
The formula for the interquartile range is given by
IQR = Q3 – Q1
On substituting the values, we get
IQR = 15 – 5 = 10
Advantages of Interquartile Range
[Click Here for Sample Questions]
The advantages of IQR are mentioned below:
- IQR is a more powerful data analysis tool than the mean or median of a data collection.
- The interquartile range is useful for determining and eliminating variance at both ends of a data collection.
- In cases with skewed data distribution, an interquartile range is also an excellent measure of variation.
Disadvantages of Interquartile Range
[Click Here for Sample Questions]
The disadvantages of IQR are mentioned below:
- IQR is less susceptible to a variety of severe scores.
- IQR has a sample consistency that is less potent than the standard deviation.
Things to Remember
- The Quartiles split a set of data series into four equal sections namely First Quartile, Second Quartile, Third Quartile, Forth Quartile.
- The First Quartile (Q1) is known as the lower quartile.
- The second Quartile (Q2) is referred to as Median.
- The third Quartile (Q3) is called the upper quartile.
- The Interquartile Range (IQR) formula calculates the middle 50% of a data collection.
- The Interquartile Range is the smallest of all statistical measures of dispersion.
- The interquartile range is the difference between the upper and lower quartiles.
- The Interquartile Range (IQR) = Upper Quartile - Lower Quartile
- The First Quartile, Q1 = [(n+1)/4] th Term
- The Third Quartile, Q3 = [(n+1)3/4] th Term
Also Read:
Sample Questions
Ques. What is the interquartile range? (2 Marks)
Ans. The interquartile range, or IQR, represents the range from the 25th percentile to the 75th percentile of a particular dataset. The IQR can be used to estimate the average range of performance on a test.
Ques. What Is meant by dispersion? (3 Marks)
Ans. Statistical calculations allow us to determine how widely apart our data is distributed. There are other methods for calculating dispersion, but the range and average deviation are often regarded as the best. The range is the difference between the lowest and greatest values in your data. The average deviation examines your mean and how each data point differs from the mean. Consider the lowest and greatest numbers in your data, for example, 2 and 7. Subtracting the lowest number from the highest value yields the range, which equals 5.
Ques. Calculate the Interquartile Range Formula for the given set of data: {4, 7, 17, 14, 12, 18, 3, 4, 16, 10, 4, 11}. (4 Marks)
Ans. The given set of data: {4, 7, 17, 14, 12, 18, 3, 4, 16, 10, 4, 11}
Arrange the data in ascending order:
{3, 4, 4, 4, 7, 10, 11, 12, 14, 16, 17, 18}
Dividing the given set of data into quartiles, we will have three numbers in each quartile.
{3, 4, 4}, {4, 7, 10}, {11, 12, 14}, {16, 17, 18}
Calculating First Quartile, Q1= (4+4)/2
= 4
Third Quartile, Q3= (14+16)/2
= 15
Now we can calculate the Second Quartile, Q2 by using the formula,
Q2=Q3-Q1
15- 4 = 11
Ques. Calculate the Interquartile Range for the first ten odd numbers. (4 Marks)
Ans. The first ten odd numbers are 1, 3, 5, 7, 9, 11, 13, 15, 17, 19
Number of elements =10
Median =10
So, dividing the data set into two parts= {1, 3, 5, 7, 9}, {11, 13, 15, 17, 19}
First Quartile, Q1= 5
Third Quartile, Q3= 15
Now we can calculate the Second Quartile, Q2 by using the formula,
Q2=Q3-Q1
=15- 5 = 10
Ques. Calculate the Interquartile Range for the first ten even numbers. (4 Marks)
Ans. The first ten even numbers are 2, 4, 6, 8, 10, 12, 14, 16, 18, 20
Number of elements =10
So, dividing the data set into two parts= {2, 4, 6, 8, 10}, {12, 14, 16, 18, 20}
First Quartile, Q1= 6
Third Quartile, Q3= 16
Now we can calculate the Second Quartile, Q2 by using the formula,
2=Q3-Q1
=16- 6 = 10
Ques. The United States of America has an estimated population of 1,520,062,022 people. Europe's population is 142,328,035. India has a population of 1,268,737,513. The United Kingdom has a population of 359,093,110. Find the range of the set of data. (4 Marks)
Ans. The given data set = {1,520,062,022, 142,328,035, 1,268,737,513, 359,093,110}
Arranging the data in ascending order:
{142,328,035, 359,093,110, 1,268,737,513, 1,520,062,022}
First Quartile, Q1= 142,328,035
Third Quartile, Q3= 1,520,062,022
Now we can calculate the Second Quartile, Q2 by using the formula,
Q2=Q3-Q1
=1,520,062,022 - 142,328,035 = 1,378,634,997
Ques. Find the IQR of the given set of data= {1, 51, 9, 21, 27, 11, 13, 15, 5, 33, 19}. (4 Marks)
Ans. The given data set = {1, 51, 9, 21, 27, 11, 13, 15, 5, 33, 19}
Arranging the data in ascending order:
{1, 5, 9, 11, 13, 15, 19, 21, 27, 33, 51}
Median = 15
Divide the given data into two sets {1, 5, 9, 11, 13} 15 {19, 21, 27, 33, 51}
First Quartile, Q1= 9
Third Quartile, Q3= 27
Now we can calculate the Second Quartile, Q2 by using the formula,
Q2=Q3-Q1
=27 - 9 = 18
Ques. Find the IQR of the given set of data= {56, 14, 84, 21, 85, 2, 35, 74, 66, 52, 45}. (4 Marks)
Ans. The given data set = {56, 14, 84, 21, 85, 2, 35, 74, 66, 52, 45}
Arranging the data in ascending order:
{2, 14, 21, 35, 45, 52, 56, 66, 74, 84, 85}
First Quartile, Q1=(N+1)4term
=11+14term
= 3rd term
= 21
Third Quartile, Q3= 3×(N+1)4term
=3×11+14term
=3×3term
= 9th term
= 74
Interquartile Range = Q3 – Q1= 74 – 21 = 53
Ques. Find the Third Quartile of the given set of data= {1,2,3,3,4,5,5,5,6,6,7}. (2 Marks)
Ans. The given data set = {1,2,3,3,4,5,5,5,6,6,7}
Number of data in the set= 11
Median = 5
To calculate the Third Quartile, Find the middle right to the median.
The middle number is 6. Hence, the Third Quartile is 6.
Ques. Find the IQR of the given set of data= {25,43,27,31,49,37,21,45,32}. (4 Marks)
Ans. The given data set = {25,43,27,31,49,37,21,45,32}
Arranging the data in ascending order,
{21,25,27,31,32,37,43,45,49}
Number of data in the set= 9
Median = 32
To calculate the First Quartile,
Q1= (25 + 27)/ 2 = 26
Third Quartile, Q3 = (43 +45)/2 = 44
Interquartile range, IQR = Q3 -Q1
= (44 - 26) x 2
=18 x 2= 36
Ques. Find the First Quartile or Q1 of the given set of data= {5,7,3,7,4,9,7,10,2,3,8}. (4 Marks)
Ans. The given data set = {5,7,3,7,4,9,7,10,2,3,8}
Arranging the given set of data in ascending order,
{2, 3, 3, 4, 5, 7, 7, 7, 8, 9,10}
Number of data in the set= 11
Median = 7
First Quartile, Q1 = 3
Third Quartile, Q3 = 8
Interquartile Range, IQR = Q3 - Q1
= 8- 3= 5
Ques. Find the First Quartile or Q1 of the given set of data= {1,2,3,3,4,5,5,5,6,6,7}. (2 Marks)
Ans. The given data set = {1,2,3,3,4,5,5,5,6,6,7}
Number of data in the set= 11
Median = 5
To calculate the First Quartile, Find the middle left to the median.
The middle number is 3. Hence, the Third Quartile is 3.
For Latest Updates on Upcoming Board Exams, Click Here: https://t.me/class_10_12_board_updates
Check-Out:



Comments