



Education Journalist | Study Abroad Lead
Uniform Distribution is a distribution function in Statistics in which every potential outcome is equally likely to occur, that is, the probability of each occurrence is the same. The uniform distribution is commonly used as the null hypothesis, or initial hypothesis, in hypothesis testing, which is used to determine the correctness of mathematical models. The uniform distribution is rectangular in shape, implying that any value in the distribution has an equal chance of occurring. A uniform distribution is used in any case where every event in a sample space is equally likely. Rolling a single die is an illustration of uniform distribution. The dice has a total of six sides, each of which has an equal chance of being rolled face up. There are basically two types of uniform distribution namely discrete uniform distribution and continuous uniform distribution.
| Table of Content |
Key Terms: Uniform Distribution, Statistics, Probability, Null Hypothesis, Events, Discrete Uniform Distribution, Continuous Uniform Distribution, Standard Deviation, Mean
Definition of Uniform Distribution
[Click Here for Sample Questions]
Uniform Distribution can be defined as a type of probability distribution in which events are equally likely to occur.
A deck of cards can also have a uniform distribution. This is due to the fact that the probability of getting a heart, or a diamond, a club, a spade are all equally possible. A coin toss is another example of a uniform distribution. Here, in this case, the chances of acquiring a tail or a head are equal.
The normal distribution is bell-shaped, which indicates that values around the middle of the distribution are more likely to occur than those towards the tails. The uniform distribution is rectangular in shape, implying that any value in the distribution has an equal chance of occurring. In a uniform distribution, any value from the set of potential values has the same chance of appearing. When presented as a bar or line graph, this distribution has the exact same height for each conceivable result.
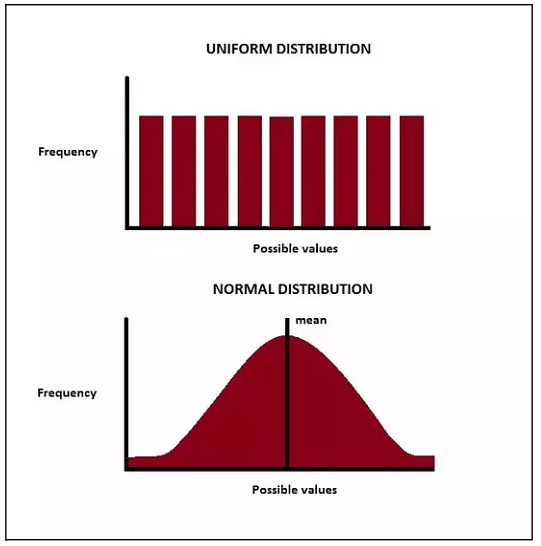
Uniform Distribution & Normal Distribution
Read More: Types of Events in Probability
Continuous and Discrete Uniform Distribution
[Click Here for Sample Questions]
There are basically two kinds of uniform distributions- discrete and continuous. In discrete uniform distribution, each of the possible outcomes is discrete while in continuous distribution, the outcomes are continuous and infinite.
- Continuous Uniform Distribution
A uniform probability distribution is a continuous probability distribution that is connected to occurrences that are equally likely to occur. It has two parameters, x and y, with x denoting the minimum value and y denoting the maximum value.
It is indicated by U (x,y) if the probability density function or probability distribution of a uniform distribution with a continuous random variable X is as follows:
\(f(b) = \frac{1}{y-x}\)where x and y are constants such that x<a<y.
It is written as
X ∼ U(a,b)
Read More: Uniform Distribution Formula
- Discrete Uniform Distribution
The discrete uniform distribution is a symmetric probability distribution in probability theory and statistics in which a finite number of values are equally likely to be observed; each of n values has an equal probability of 1/n. "A known, finite number of equally likely possibilities" is another way of putting "discrete uniform distribution."
Throwing a dice is a basic illustration of the discrete uniform distribution. The available values are 1, 2, 3, 4, 5, 6, and the likelihood of a certain score is 1/6 each time the die is thrown. Because not all sums have equal probability, the resultant distribution is no longer uniform when two dice are thrown and their values are summed. Although discrete uniform distributions over integers, such as this, are straightforward to express, discrete uniform distributions over any finite set can also be considered.

Uniform Distribution
Read More: Probability Impossible Events
Theoretical Mean of Uniform Distribution
The theoretical mean of the uniform distribution can be calculated using the given formula:
μ = \(\frac{(x+y)}{2}\)
Read More: Sample Mean Formula & Solved Examples
Standard Deviation Formula of Uniform Distribution
[Click Here for Sample Questions]
The standard deviation formula of the uniform distribution is as follows:
σ = \(\sqrt{\frac{(y-x)^2}{12}}\)
Uniform Distribution: Example
[Click Here for Sample Questions]
The table given below shows the number of passengers on 35 different cabs. The sample mean and the sample standard deviation of the given data are 7.9 and 4.33 respectively. The given data follows a uniform distribution where all values between zero and 14 (both inclusive) are equally likely to occur. Calculate what will be the values of x and y. Also, what will be the theoretical mean and standard deviation?
| 1 | 7 | 3 | 5 | 6 |
| 12 | 11 | 10 | 13 | 4 |
| 10 | 13 | 12 | 10 | 0 |
| 4 | 4 | 0 | 11 | 4 |
| 11 | 14 | 6 | 2 | 4 |
| 2 | 11 | 10 | 6 | 11 |
| 14 | 13 | 12 | 9 | 4 |
Solution: Given that
Sample mean = 7.9
Sample Standard Deviation = 4.33
It is clear that the distribution lies between 0 and 14.
Thus,
x = 0 and y = 14
Theoretical mean = μ = (x + y)/2 = (0 + 14)/2 = 7
Theoretical Standard Deviation = σ = √[(x – y)2/12] = √[(0 – 14)2/12
= \(?(196/2)\)
= \(?98\)
= 9.899
Read More: Variance
Things to Remember
[Click Here for Sample Questions]
- The uniform distribution is a sort of probability distribution in Statistics in which all conceivable outcomes are equally likely.
- A coin flip has a uniform distribution since the chance of receiving heads or tails is the same. The uniform distribution may be seen as a straight horizontal line, thus a coin flip that returns to a head or tail has a probability of p = 0.50, and the line from the y-axis at 0.50 would be depicted.
- Uniform distributions are basically divided into two types: discrete and continuous. Each of the potential outcomes is discrete in the former kind of distribution. The outcomes of continuous distribution are both continuous and limitless.
- The theoretical mean of uniform distribution is given as μ = (x + y)/2.
- The standard deviation formula of the uniform distribution is σ = \(\sqrt{}[(x – y)2/12\)
Sample Questions
Ques. What do you mean by "uniform distribution"? (3 Marks)
Ans. A continuous distribution that is bounded on both sides is referred to as a uniform distribution. Its density is independent of x's value. It's a unique instance of the Beta distribution. The rectangle distribution is another name for it. The uniform distribution is used to depict a random variable that has a constant probability of falling inside a limited interval between the minimum and maximum. If you want your target outcomes to be between two values, you should utilise the uniform distribution.
- It is generally defined by two parameters, x and y, where x = minimum value and y = maximum value.
- It is generally depicted as u(x, y).
Ques. What is the definition of discrete uniform distribution? (5 Marks)
Ans. In statistics and probability theory, a discrete uniform distribution is distribution n statistics with restricted values and equal probability of occurrences. Rolling a 6-sided dice produces a range of results, which is an example of a discrete uniform distribution.1, 2, 3, 4, 5, or 6 are examples of potential values. Each of the six numbers has an equal probability of occurring in this situation. As a result, each side of the 6-sided die has a 1/6 probability every time it is thrown.
Discrete uniform distribution may be beneficial to organisations in a variety of ways. It can come up in inventory management when looking at the frequency of inventory sales, for example. It can provide a probability distribution that can help the company decide how to best allocate inventory to maximise square footage.
Ques. What is the difference between a uniform and a normal distribution? (5 Marks)
Ans. A uniform distribution is one in which all potential values within a particular range are equally likely. The normal distribution is characterised by values clustering around the mean or average and the absence of outlying values.
The median and mean of both the uniform and normal distributions are equal, and all the values in any given range that are greater than the mean are equally feasible as the equivalent range that is lower than the mean. For a normal distribution with a mean of 5, for example, the ranges 8 - 9 are equally conceivable as the ranges 1 - 2. Both ranges are 3 - 4 standard deviations from the mean. This is true regardless of the standard deviation; however, the precise possibilities are influenced by the standard deviation.
Ques. Is it normal to have a uniform distribution? (3 Marks)
Ans. The term "normal" refers to how data is spread around the mean. The chance of a variable appearing near the mean, or the centre, is higher with normal data. As you move away from the average, fewer data points are seen, implying that the chance of a variable happening far from the mean is decreased. With normal data, the probability is not uniform, but with a uniform distribution, it is constant. As a result, a uniform distribution is not considered typical.
Ques. What does it mean to have a continuous uniform distribution? (5 Marks)
Ans. Some uniform distributions are continuous, whereas others are discrete. In ismpler terms, a statistical distribution with an infinite number of equally likely measurable values can be defined as a continuous uniform distribution. Continuous random variables, unlike discrete random variables, can take any actual value within a specified range.
One must know that a rectangular shape is typical for a continuous uniform distribution. An idealised random number generator is a nice example of a continuous uniform distribution. Every variable has the same chance of appearing in a continuous uniform distribution as it does in a discrete uniform distribution. Despite this, there are an endless number of valid points.
Ques. Where do normal and uniform distribution? (5 Marks)
Ans. Normal distributions depict the distribution of continuous data and state that the majority of the data is centred on the mean or average. In a normal distribution, the area under the curve equals one, and 68.27% of all data falls within one standard deviation of the mean; Approximately 99.73 per cent of all data is within two standard deviations of the mean, whereas 95.45 per cent is within 3 standardized deviations of the mean. 1 The frequency of data happening reduces as the data travels away from the mean.
Variables in a range have the same probability of occurring, according to a discrete uniform distribution. There are no possible outcomes that differ, and the data is discrete rather than continuous. Rather than the bell shape of the normal distribution, it resembles a rectangle. The area under the graph, like a normal distribution, is equal to one.
Ques. What are the examples of uniform distribution? (5 Marks)
Ans. The simplest statistical distribution is the uniform distribution. The cornerstone of statistical analysis and probability theory is the uniform distribution notion, as well as the random variables it explains.
For example, if you stood on a street corner and began handing out $100 bills to each lucky passing, each pedestrian would have an equal chance of receiving the cash. The probability per cent is 1 divided by the entire number of potential outcomes.
A uniform distribution may also be found in a deck of cards. This is because the chances of drawing a spade, a heart, a club, or a diamond by are a person are all equall. A uniform distribution may also be seen in a coin toss. Either a tail or a head has an equal probability of being acquired. A uniform distribution graph's sides and top are generally parallel to the y- and x-axes.
Ques. The average weight that is gained by a person over the winter months is uniformly distributed and it ranges from 0 to 30 lbs. What will be the probability of a person that he will gain between 10 and 15lbs in the winter months? (3 Marks)
Ans. First, we need to find the total height of the distribution. We know that the area under the probability distribution is always 1. As there are 30 units starting from 0 to 30, the height will be 1/30.
Now, we need to find the width of the slice of the distribution. We can get this by subtracting the biggest number b from the smallest number a,
b – a
= 15 – 10
= 5.
Now, we will get the probability by multiplying the width by the height,
Probability = 5×(1/30) =5/30
=16
Read More:



Comments