



Education Journalist | Study Abroad Lead
Average Revenue refers to the revenue that is obtained by a firm or a seller on selling each unit of the commodity or products. This helps companies to calculate valuable information about the company’s revenue. By showing a company's revenue generation capability, it also gives them an idea about the steps they can take for the company’s overall growth in the market. Analysts and investors find it useful to compare the average revenue per unit (ARPU) numbers from rivals in the same industry. It tells which firm or organisation is doing the best in increasing revenue from its subscribers or users.
| Table of Contents |
Key Terms: Average Revenue, Revenue Generation Capability, Price, Profit, Output, Revenue
What is Average Revenue?
[Click Here for Sample Questions]
The average revenue (AR) of a firm is defined as total revenue that is generated or earned per unit of output. The average revenue per unit (ARPU) helps the company's investors or management team to analyse revenue generation capability and hence, forecast future growth. The average revenue of a company’s products when it sells one product at one price, is basically the price of the product. So, in many situations, the terms price and average revenue mean the same. But if a company sells two or more than two products, all at different prices, the company’s profits are estimated through this average revenue.
Average Revenue Formula
[Click Here for Sample Questions]
The mathematical formula for calculating average revenue is:
AR = TR/Q
Where, AR represents the Average Revenue, TR represents the Total Revenue and Q is the Output.
For instance, if the firm sells about 2000 units of the commodity and has a total revenue of INR 20,000, the average revenue is calculated as :
AR = 20,000 / 2000 = INR 10
Hence, the firm sells this commodity at INR 10 per unit price.
Average Revenue Curve
[Click Here for Sample Questions]
Average Revenue Curve is a graphical representation of the relation between average revenue received by a firm for selling its output and the quantity of output sold. The average revenue curve is also the demand curve for a firm's output because average revenue is essentially the price of a good. A horizontal average revenue curve means no market control whereas a negatively sloped average revenue curve means the firm has a market control . This curve also helps a firm or an organisation to reflect on the extent to which they have market control.
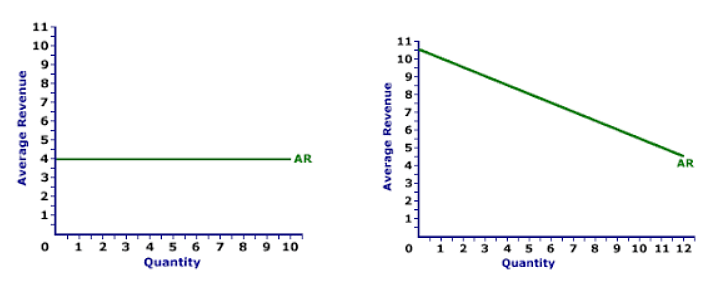
Average Revenue Curve
Uses of Average Revenue Formula
[Click Here for Sample Questions]
ARPU is used across varied fields. Some of its wide range applications are mentioned below:
- In order to identify potential issues and new monetization strategies, businesses can use ARPU to extract more ROI from their mobile apps.
- In the case of mobile analytics, ARPU helps to find out how much revenue was collected with each app install. This data is used by investors, management and market to analyse how effectively the company is turning individual users into revenue.
- ARPU also helps evaluate campaigns and ad networks on a per-user basis, which provides insight into the quality of users from every source.
- ARPU has a direct impact on our ability to scale.
Things to Remember
- The average revenue (AR) of a firm is defined as total revenue generated per unit of output by an organisation.
- It helps to analyse revenue generation capability of an organisation and simultaneously its future growth.
- The mathematical formula for calculating average revenue is: AR = TR/Q
- Average Revenue Curve determines the relation between average revenue received by a firm for selling its output and the quantity of output sold.
- A firm with no market control will have a horizontal average revenue curve.
- A firm with market control will have a negatively sloped average revenue curve.
Sample Questions
Ques. Explain the relation between Marginal Revenue and Average Revenge. (3 marks)
Ans. Relationship between Marginal Revenue (MR) and Average Revenue (AR) is as follows:
- When AR curve rises, MR > AR
- When the AR curve reaches its maximum and constant, MR = AR.
- When the AR curve falls, MR < AR.
- MR curve can be zero or negative however, AR curve can neither be zero nor negative.

Ques. A firm can sell as many units of a good as it wants to sell at a given price. Draw
(1) Total Revenue curve
(2) Average Revenue and Marginal Revenue curves of the firm.
(3) Also state the relation between Average Revenue and Marginal Revenue curves in this case. (4 marks)
Ans. 1. Here, AR and MR curves are perfectly elastic and TR curve is upward sloping straight line because as output rises, the price remains constant and TR increases

- When firm can sell any level of output at a given price, it means that price, i.e. AR remains constant. Also, AR and MR coincide due to equivalence of Marginal Revenue (MR) to Average Revenue (AR). Here, AR is constant. Also, TR will be a straight line from origin indicating that TR is increasing at a constant rate, since MR is constant.
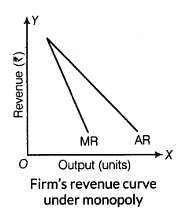
Ques. Draw Average Revenue and Marginal Revenue curves in a single diagram of a firm, which can sell more units of a good only by lowering the price of that good. Explain. (3 marks)
Ans. The slope of Average Revenue and Marginal Revenue curve of the firm in such a case will be downward, since under this type of marketing, firms will be selling more units of goods only by lowering the price of those goods. In other words, the output of such market forms will be higher. Alsom the MR curve will lie below the AR curve since the additional revenue of each additional revenue sold is less than the price of the resulting output.
Ques. Draw a single diagram of the Average Revenue and Marginal Revenue curves of a firm, which can sell any quantity of the good at a given price. Explain. (3 marks)
Ans. The curve of Average Revenue and Marginal Revenue where the firm can sell any quantity of the good at a given price will be a horizontal straight line, since the firm is not charging the market price and is selling any number of units at the particular prevailing price. In this case, if the firm tries to sell the goods at a price higher than prevailing market price, there is a possibility that the firm might lose all its customers.

Ques. Calculate TR, MR and AR. (3 marks)

Ans. Tabulated below are the TR, MR and AR:

Ques. Complete the following table. (4 marks)

Ans. Mentioned below is the complete table:

Ques. Calculate the TR and AR from the following. (4 marks)

Ans. Tabulated below are the TR and AR:

Ques. Calculate the Average Revenue (AR) and Marginal Revenue (MR). (3 marks)

Ans. Tabulated below are the MR and AR:

Ques. Calculate TR and MR from the following data. (4 marks)

Ans. Tabulated below are the TR and MR:

Ques. Complete the following table. (4 marks)

Ans. Mentioned below is the complete table:

For Latest Updates on Upcoming Board Exams, Click Here: https://t.me/class_10_12_board_updates
Check-Out:



Comments