



Education Content Expert
Median is a measure of central tendency that represents the middle value for a given set of data. Mean, Median, and Mode are the three measures of central tendency in Statistics.
- Median is the middle value of a given list of data arranged in an order.
- The order of arrangement of the data can be in ascending or descending order.
- Median is a type of average that is used to find the center value.
- Median is the central point at which half the data is more and half the data is less.
- The values above the median are known as the higher half while the values below are known as the lower half.
Median of Grouped Data is the calculation of the median of the data that is continuous and is in the form of frequency distribution. Median of Grouped Data is calculated using the given formula:
| \(Median = l+ \left ( \frac{\frac{n}{2}-cf}{f} \right )\times h\) |
Read More: NCERT Solutions For Class 10 Maths Statistics
Key Terms: Median, Median of Grouped Data, Measure of Central Tendency, Grouped Data, Ungrouped Data, Median Formula
What is Median?
[Click Here for Sample Questions]
Median is the middlemost value of a data set when it is arranged in an ascending order or descending order.
- Median is a measure of central tendency that represent a large dataset with a single data point.
- It is the easiest statistical measure to calculate.
- It is the middlemost value of a dataset that separates the upper half of the data from the lower half.
- Median is a Positional Average as it considers the value placed in the center of the dataset.
- To calculate the median, the data is arranged in an order, and then the middlemost data point is the median of the data.
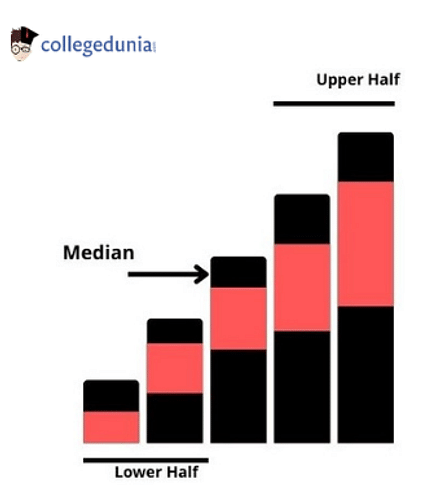
Median
Read More:
Median of Grouped Data
[Click Here for Sample Questions]
Median of Grouped Data refers to the median calculated for the data that is continuous and is in the form of frequency distribution. The data is arranged in the form of a frequency distribution table in which the higher level of data is separated from the lower level of data. Median of Grouped Data is considered to be one of the easiest formulas in Statistics.
The steps to find the Median of Grouped Data are as follows:
- Step 1: First, find the total number of observations (n) given.
- Step 2: List the class size (h) and divide the data accordingly into classes.
- Step 3: Proceed to calculate the cumulative frequency of each of the classes.
- Step 4: Identify the class having the median. It is the class where n/2 lies.
- Step 5: Find the lower limit of the median class (l) and calculate its cumulative frequency (c).
Thus, Median of Grouped Data Formula is given as follows:
| \(Median = l+ \left ( \frac{\frac{n}{2}-cf}{f} \right )\times h\) |
- l: Lower Limit of Median Class
- n: Total Number of Observations
- f: Frequency of Each Class
- c: Cumulative Frequency
- h: Class Size
Mean, Median and Mode Video Explanation
How to Find Median of Grouped Data?
[Click Here for Sample Questions]
Median of Grouped Data refers to the median of continuous data given in the form of a frequency distribution arranged in ascending order. The value of the median needs to be calculated inside the class interval that divides the whole distribution into two halves. The class interval that divides the data into two halves is referred to as Median Class.
Here are the steps to calculate or find the Median of Grouped Data:
- Step 1: Draw the frequency distribution table of the given data with class intervals and frequencies.
- Step 2: Next, calculate the cumulative frequency of the data by adding up the preceding value of the frequency with the current one.
- Step 3: Calculate n by adding up all the values in frequency.
- Step 4: Next, find the median class.
- Step 5: If n is odd, the median will ve (n+1/2). If n is even, the median is the average of the n/2th and the (n/2 +1)th observation.
- Step 6: Calculate the lower limit of the class interval.
- Step 7: Use the Median Formula for Grouped Data, i.e. Median = l + [(n/2−c)/f] x h and calculate the median.
Read More: Statistics Important Questions
Median of Grouped Data Example
[Click Here for Sample Questions]
In order to calculate the Median of Grouped Data, the data needs to be continuous and in the form of frequency distribution. Here is an example on how to calculate the Median of Grouped Data using the steps mentioned above.
Example: A school conducted a physical test for girls and recorded the following data for the height of the girls.
| Height (In cm) | 120-130 | 130-140 | 140-150 | 150-160 | 160-170 | Total |
|---|---|---|---|---|---|---|
| Number of Girls | 2 | 8 | 12 | 20 | 8 | 50 |
What is the Median Age of the Girls in the school?
Solution: The data values are already arranged in form of a frequency distribution table. Thus, first, we need to calculate the cumulative frequencies.
| Class Intervals | Number of Girls (fi) | Cumulative Frequency (c) |
|---|---|---|
| 120-130 | 2 | 2 |
| 130-140 | 8 | 2 + 8 = 10 |
| 140-150 | 12 | 10 + 12 = 22 |
| 150-160 | 20 | 22 + 20 = 42 |
| 160-170 | 8 | 42 + 8 = 50 |
Now, n = 50
Thus, n/2 = 25
25 lies in the class interval 150-160, thus, the median class is 150 - 160.
Using the Median of Grouped Data Formula.
\(Median = l+ \left ( \frac{\frac{n}{2}-cf}{f} \right )\times h\)
We have,
- l = 150
- c = 22
- f = 20
- h = 10
Substituting the values in the formula, we get
Median = 150 + [((50/2) - 22)/20] × 10 = 150 + 1.5 = 151.5
Thus, the median height of the girls in the school is 151.5 cm.
Check More:
Median of Ungrouped Data
[Click Here for Sample Questions]
Median of Ungrouped Data refers to the calculation of the median for the data values that are not arranged in the form of a frequency distribution table. Median for Ungrouped Data is calculated using the given steps:
- Step 1: Arrange the given data values in ascending or descending order.
- Step 2: Count the number of observations 'n'.
- Step 3: See if the number of observations 'n' is even or odd number.
On the basis of the total number of observations, Median is calculated using two formulas for ungrouped data.
- Median Formula When n is Odd
- Median Formula When n is Even
Median Formula When n is Odd
When the total number of values is an odd number, then the median is calculated using the formula:
| Median = [(n + 1)/2]th Term |
Where n denotes the total number of values.
Solved ExampleExample: What will be the median of data: 10, 4, 6, 7, 12, 13, and 5? Solution: The data values are 10, 4, 6, 7, 12, 13, and 5. Arranging the values in ascending order: 4, 5, 6, 7, 10, 12, 13 Here, n = 7 (Odd Number). Using the Median Formula When n is Odd, Median = [(n + 1)/2]th term Median = {(7+1)/2}th term = 4th term = 7 Thus, the median of the given dataset is 7. |
Median Formula When n is Even
When the total number of values is an even number, then the median is calculated using the formula:
| Median = [(n/2)th Term + ((n/2) + 1)th Term]/2 |
Where n denotes the total number of values.
Solved ExampleExample: Determine the median of 3, 15, 2, 34, 11, and 25. Solution: Given data values are 3, 15, 2, 34, 11, and 25. On arranging the data values in ascending order, we get 2, 3, 11, 15, 25, 34 Here, n = 6 (Even Number). Using Median Formula When n is Even, Median = [(n/2)th term + ((n/2) + 1)th term]/2 Median = [(6/2)rd term + ((6/2)th term + 1)]/2 = (3rd term + 4th term)/2 Median = (11 + 15)/2 = 26/2 = 13 Thus, the median is 13. |
Things to Remember
- Median is a measure of central tendency along with Mean and Mode.
- Median is the middlemost value of an arranged data set that separates the dataset into two equal halves.
- It is a Positional Average and is considered the easiest measure to calculate.
- Median of Grouped Data is the median of data given in the form of a continuous frequency distribution table.
- Median of Grouped Data Formula is \(Median = l+ \left ( \frac{\frac{n}{2}-cf}{f} \right )\times h\).
- Median of Ungrouped Data is calculated differently for odd and even numbers of observations.
- Median Formula for odd number of terms is M = [(n+1)/2]th Term.
- Median Formula for even number of terms is M = [(n/2)th Term + ((n/2) + 1)th Term]/2.
For Latest Updates on Upcoming Board Exams, Click Here: https://t.me/class_10_12_board_updates
Sample Questions
Ques. The following data represents the survey regarding the heights (in cm) of 51 girls of Class X. Find the median height. (5 Marks)

Ans. The given frequency distribution is in the form of being less than type in which 145, 150 …and 165 give the upper limit. Thus, the class should be below 140, 140-145, 145-150, 150-155, 155-160, and 160-165.
- Frequency of 140-145 = 11-4 = 7
- Frequency of 145 -150= 29 – 11 = 18
- Frequency of 150-155 = 40-29 = 11
- Frequency of 155 – 160 = 46-40 = 6
- Frequency of 160-165 = 51-46 = 5
Thus, the frequency distribution table along with the cumulative frequencies is given below:
| Class Intervals | Frequency | Cumulative Frequency |
|---|---|---|
| Below 140 | 4 | 4 |
| 140 – 145 | 7 | 11 |
| 145 – 150 | 18 | 29 |
| 150 – 155 | 11 | 40 |
| 155 – 160 | 6 | 46 |
| 160 – 165 | 5 | 51 |
Here, n= 51.
Therefore, n/2 = 51/2 = 25.5
Thus, the observations lie between the class interval 145-150, which is called the median class.
Therefore,
- Lower class limit = 145
- Class size, h = 5
- Frequency of the median class, f = 18
- Cumulative frequency of the class preceding the median class, c = 11.
Using the Median of Grouped Data Formula,
\(Median = l+ \left ( \frac{\frac{n}{2}-cf}{f} \right )\times h\)
Median = 145 + [\( \frac{{25.5}-{11}{}}{18}\)] x 5 = 149.03
Thus, the median height of the girls is 149.03 cm.
Ques. What will be the median of the given dataset: 10, 4, 8, 7, 12, and 5? (3 Marks)
Ans. Given values are 10, 4, 8, 15, 12, and 5.
Arranging the data in ascending order: 4, 5, 8, 10, 12, 15
Here, n = 6 (Even Number).
Using Median Formula When n is Even,
Median = [(n/2)th term + ((n/2) + 1)th term]/2
Median = [(6/2)th term + ((6/2)+ 1)th term]/2
Median = (3rd term + 4th term)/2 = (8 + 10)/2 = 9
Thus, the median is 9.
Ques. Find the median of the following data: 19, 25, 30, 31, 32, 35, 48, 51, and 59. (3 Marks)
Ans. Given values are 19, 25, 30, 31, 32, 35, 48, 51, and 59.
Arranging the given data in ascending order, we get
19, 25, 30, 31, 32, 35, 48, 51, 59
Here, the number of observations is 9 which is odd.
Using the Median Formula When n is Odd,
Median = [(n + 1)/2]th term = ((9+1)/2)th
Median = 5th term = 32
Thus, the median is 32.
Ques. What is Median? (2 Marks)
Ans. Median is defined as the middlemost value of a dataset arranged in ascending order. The values above the median are known as the higher half while the values below are known as the lower half. It is a positional average denoting the central value of an arranged data set.
Median can be calculated for types of data:
- Median for Grouped Data
- Median for Ungrouped Data
Ques. What is Median Class? (1 Mark)
Ans. Median Class is the class interval whose cumulative frequency is greater than (and nearest to) n/2.
Ques. What is Median of Grouped Data Formula? (2 Marks)
Ans. Median of Grouped Data Formula is given as:
\(Median = l+ \left ( \frac{\frac{n}{2}-cf}{f} \right )\times h\)
Here
- l refers to the lower limit of the median class.
- n refers to the number of observations.
- f refers to the frequency of the median class.
- h refers to the class size.
- cf refers to the cumulative frequency of the class preceding the median class.
Ques. What is Cumulative Frequency? (3 Marks)
Ans. Cumulative Frequency is the total frequency where the frequency of the first class interval is added to the frequency of the second class interval and then the sum is added to the frequency of the third class interval and so on.
Consider the example given below:
| Age Group | Frequency | Cumulative Frequency |
|---|---|---|
| 10-15 | 20 | 20 |
| 15-20 | 32 | 52 |
| 20-25 | 18 | 70 |
| 25-30 | 30 | 100 |
Here the cumulative frequency is calculated by adding up the existing frequency to the next ones.
Ques. Determine the median for the given dataset: 5, 7, 4, 8, 6. (3 Marks)
Ans. Given dataset is 5, 7, 3, 8, 6
Here, the number of observations = 5 (Odd)
Now, arrange the numbers in ascending order.
3, 5, 6, 7, 8
Using the Median Formula When n is Odd,
Median = {(n+1)/2}th term
Median = {(5+1)/2}th term
Median = 3rd term = 6
Thus, the median of the given dataset is 6.
Ques. What is the Median Formula for Ungrouped Data? (2 Marks)
Ans. Median Formula for Ungrouped Data is divided into two types depending on the number of observations in the given data set.
- Median Formula for n (odd) number of terms is M = [(n+1)/2]th Term.
- Median Formula for n (even) number of terms is M = [(n/2)th Term + ((n/2) + 1)th Term]/2.
Ques. What is the median of the given data set: 42, 40, 50, 60, 35, 58, and 32? (3 Marks)
Ans. The data values are given as 42, 40, 50, 60, 35, 58, and 32.
On arranging them in ascending order, 32, 35, 40, 42, 50, 58, 60.
Here, n = 7 (Odd Number).
Using Median Formula When n is Odd,
Median = [(n + 1)/2]th term = (7 + 1)/2th term = 4th term = 42
Thus, the median is 42.
Check More:



Comments