



Content Curator
Different types of data in statistics are Nominal data, Ordinal data, Discrete data, and Continuous data.
- These data are collected, analyzed, interpreted, and presented.
- The data are discrete pieces of factual information that have been captured and will be used in the analysis process.
- Interpretation and presentation are the two stages of data analysis.
- The consequence of data analysis is statistics.
- Data categorization and data processing are crucial operations since they require a large number of tags and labels to characterize the data, as well as its integrity and secrecy.
| Table of Content |
Key Terms: Statistics, Data, Types of data, Nominal data, Ordinal data, Discrete data, Continuous data, Numerical Data, Categorical Data, Pie chart, Graphs
What are the Types of Data in Statistics?
[Click Here for Sample Questions]
The four major types of data in statistics are
- Nominal data
- Ordinal data
- Discrete data
- Continuous data
Also check:
| Related Concepts | ||
|---|---|---|
| Set Operations | Operations on Rational Numbers | Irrational Numbers |
| Euclid's Proof | Real numbers formula | Properties of real numbers |
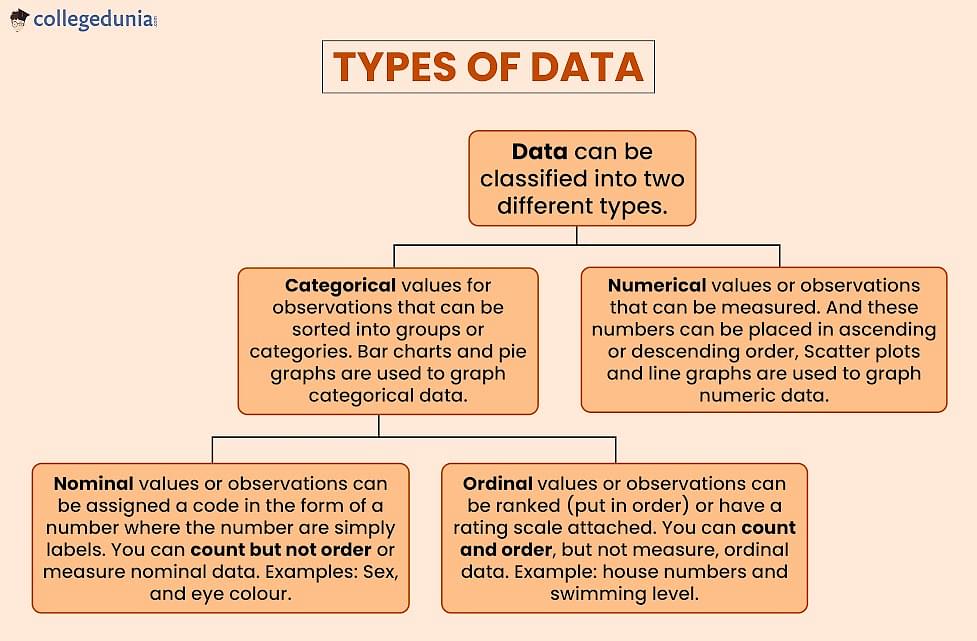
Qualitative or Categorical Data
[Click Here for Sample Questions]
Qualitative data, commonly referred to as categorical data, describes data that fits into specific categories.
- Qualitative data is not numerical.
- Categorical information includes categorical variables that define characteristics such as a person's gender, hometown, and so on.
- Categorical measurements are specified in terms of natural language requirements rather than numerical values.
- Categorical data can sometimes contain numerical values (quantitative values), but these values are not mathematically meaningful.
- Categorical data examples include birthdays, favorite sports, and school postcodes.
- The birthday and school postcode have a quantitative value, but they have no numerical meaning.

Nominal Data
Nominal data is a sort of qualitative data that aids in the labeling of variables without providing a numerical value.
- The nominal scale is another name for nominal data.
- It can't be measured or ordered.
- However, data may be both qualitative and quantitative at times.
- Letters, symbols, words, gender, and other nominal data are examples of nominal data.
- The grouping method is used to analyze the nominal data.
- The data are categorized into categories in this manner, and the frequency or percentage of the data may then be determined.
- Pie charts are used to visually depict this information.

Ordinal Data
A bar chart is widely used to display ordinal data. Many visualization technologies are used to examine and comprehend this data.
- Tables may be used to convey the information, with each row representing a separate category.
- The order of the value is crucial and vital in ordinal data scales, but the distinction between them is unknown.
- In each of the examples below, number four is superior to numbers three and two, but the magnitude of the superiority cannot be measured.
- For example, we can't tell the difference between 'unhappy' and 'ok,' nor can we tell the difference between 'very happy' and 'happy.'
- Ordinal scales are commonly used to quantify non-numerical variables such as happiness, contentment, pain, and so on.
- Ordinal scales are easy to remember since they sound like an order, and that is the key thing to remember with ordinal scales.
- What counts is that you get orders, and that is what you get from these.

Quantitative or Numerical Data
[Click Here for Sample Questions]
Numerical data, often known as quantitative data, represents a numerical value (i.e., how much, how often, how many).
- Numerical data is information about a certain thing's quantities.
- Height, length, size, weight, and other numerical statistics are examples of numerical data.
Numerical data is divided into two categories:
- Discrete data
- Continuous data.

Discrete Data
Discrete data has discrete and independent values.
- If just specified values are required, discrete data is beneficial.
- Although this information cannot be measured, it can be tallied.
- It usually refers to data that has been organized into categories.
Example: Number of students in the class
Continuous Data
Continuous data can be calculated. It has an infinite number of possible values that can be chosen within a specified range.
Example: Temperature range
Also check:
| Relevant Topics | ||
|---|---|---|
| Rational Numbers NCERT Solutions | Degrees of polynomial | Question on real numbers |
| Root 2 is irrational | Set Operations | Arithmetic Properties |
Things to Remember
- There are various types of data in Statistics, that are collected, analyzed, interpreted, and presented.
- The data are referred to as the individual pieces of factual information recorded, also it is used for the purpose of the analysis process.
- The two processes of data analysis are interpretation and presentation.
- Statistics are based on the data analysis.
- Qualitative data is the data that falls into one of the categories.
- Nominal data is a sort of qualitative data that aids in the labeling of variables without providing a numerical value.
- A bar chart is widely used to display ordinal data.
Sample Questions
Ques. What is data? (2 Marks)
Ans. Data refers to a systematic record of a specific quantity. It is the diverse values of that quantity together which the sets represent. In other words, it is a set of facts and figures which are useful for a particular purpose like a survey or an analysis. Moreover, when you arrange them in an organized form, they are referred to as information. Moreover, the source of data primary or secondary is also an essential factor.
Ques. What are the 4 types of data in statistics? (1 Mark)
Ans. The 4 types of data in statistics are Nominal, Ordinal, Discrete, and Continuous.
Ques. What do you mean by statistics? (2 Marks)
Ans. Statistics is the discipline concerned with data collection, organization, analysis, interpretation, and presentation. When applying statistics to a scientific, industrial, or social problem, it is conventional to start with a statistical population or model to be studied.
Ques. What are the different types of statistics? (1 Mark)
Ans. There are two types of statistics: descriptive statistics and inferential statistics.
Ques. Define the two major words used to classify data. (2 Marks)
Ans. Data may be divided into two categories at the most basic level. Quantitative and qualitative data are the two basic forms of data. Qualitative data refers to qualities or attributes. It also denotes descriptions that we can see but not compute or calculate. Smell, taste, beauty, and intelligence are all examples. As a result, when you assess or categorize anything, you generate qualitative data. Quantitative data, on the other hand, can be measured but not observed. It is numerically represented, and we may conduct computations on it. Age, cost, quantity, height, and length are all examples. Quantitative data is created when anything is measured in terms of a numerical value.
Ques. What is discrete data, and how does it differ from continuous data? (2 Marks)
Ans. The two broadest forms of data are qualitative and quantitative, as we've seen. There are two additional kinds of quantitative data: continuous and discrete data. We can only examine individual values rather than a range of values when dealing with discrete data. The data in a population's blood group or gender is a good example of discrete data. Bar charts are a frequent technique to depict this data. These numbers could not be more exact or comprehensive. As an example, a person cannot claim to have 2.3 children. Discrete data, on the other hand, counts full indivisible entities or units.
Ques. What is the definition of inferential statistics? (2 Marks)
Ans. The technique of employing data analysis to understand the characteristics of an underlying probability distribution is known as inferential statistics. It uses information from a sample to generate conclusions about the wider population from which the sample was collected.
Ques. What is the difference between descriptive and inferential statistics? (2 Marks)
Ans. Inferential statistics are used to interpret acquired data, whereas descriptive statistics are used to describe a particular collection of data. The first, is descriptive statistics, while the second, is inferential statistics. Data from a sample population is used to form conclusions about the broader population from which the sample was derived in inferential statistics.
Ques. What is primary data, and how does it differ from secondary data? (2 Marks)
Ans. Primary data is information gathered for the first time for a specific purpose by an investigator. Furthermore, this data is 'pure' in the sense that no statistical processes have been done on it, and it is also original. India's Census is an example of primary data.
Ques. What do you mean by discrete data? (2 Marks)
Ans. Discrete data is data that can only examine a few distinct values rather than a range of values. Discrete data, for example, is information on a population's blood group or gender. In addition, bar charts are a frequent technique to display this information.
For Latest Updates on Upcoming Board Exams, Click Here: https://t.me/class_10_12_board_updates
Also Read:



Comments