



Education Journalist | Study Abroad Lead
Pyramid of Biomass is the pyramid that is used to depict the relationship between biomass, bio productivity, number of various trophic levels in any ecosystem. It can also be termed as the Eltonian Pyramid or the ecological pyramid. It is used to represent the energy flow in a system that describes the available biomass in any particular trophic level of any energy level in a specific time.
| Table of Content |
Keyterms: Pyramid, Biomass, Bio productivity, Ecosystem, Trophic level, Enery flow, Eltonian Pyramid, Ecological pyramid, Living organisms
Biomass
[Click Here for Sample Questions]
Biomass is the mass of the living organisms that belong to an ecosystem at any sample size. There are two major kinds of biomass which include the species biomass and the community biomass. Species biomass is the biomass of a particular species while the community biomass is the biomass of all the species present in a territory. It is depicted as the dry weight measured in grams or calories per unit area. To measure biomass, one needs a bomb calorimeter.
The video below explains this:
Pyramid of Biomass Detailed Video Explanation:
Also Read: Mutualism
Pyramid of Biomass
[Click Here for Sample Questions]
The pyramid of biomass is the graphical representation of biomass availability at several trophic levels. Trophic level is the level or a stage that any living being attains in a food chain. In the pyramid of biomass, the 1st trophic level belongs to the producers present at the base, succeeded by the primary consumers of herbivores at the 2nd trophic level. After this there are the secondary or tertiary consumers, also called the carnivores at the topmost level. This representation depicts the flow of energy from the bottom to the top order, which is from the producers to the consumers. For a fact, there is only 10% energy transfer that takes place from one trophic level to another. The leftover energy gets used up in the different metabolic processes or is excreted out.
The biomass pyramid is of two kinds which include the upright and the inverted biomass pyramid. The different examples of the biomass pyramid are the grassland ecosystem, tree ecosystem, marine ecosystem, and many others.
Biomass Pyramid of Grassland Ecosystem
The Biomass Pyramid of the Grassland Ecosystem is of an upright kind. In the grassland ecosystem, the grasses attain the 1st trophic level with the maximum biomass, succeeded by the herbivores or the primary consumers at the 2nd ecosystem like rats, rabbits, etc. The third trophic level is occupied by the snakes, owls, lizards which fall under the category of secondary consumers and the topmost level is occupied by the tertiary consumers such as eagles. In a grassland ecosystem, the biomass at the base level is higher than that of the 1st level and further decreases in the other following levels. Biomass in an ecosystem is calculated by multiplying the number of organisms by the biomass of organisms at a particular trophic level.
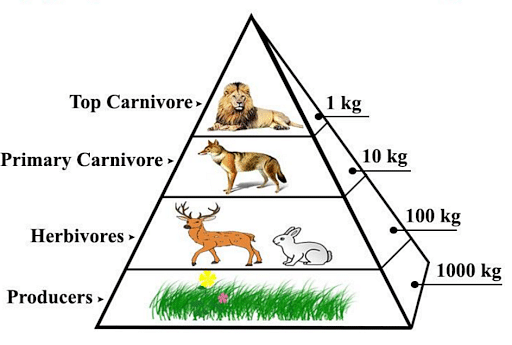
Biomass Pyramid of Grassland Ecosystem
Biomass Pyramid of Tree Ecosystem
It is considered that the biomass pyramid is significantly better than the number pyramid. In a tree ecosystem, the number pyramid is not considered effective as there can be hundreds of insects present on a single oak tree. These insects in turn can be consumed by a few birds.
In a tree ecosystem, the producer is an oak tree, followed by the caterpillar or insects as the primary consumers, followed by the secondary consumers as woodpeckers. The biomass pyramid in the case of tree grassland is the upright one.
Biomass Pyramid of a Marine Ecosystem
In the case of a marine ecosystem, the biomass pyramid is an inverted one. Here, the biomass pyramid is an inverted one where the primary producers have less biomass than that of herbivores which are zooplanktons, which is further less than the primary carnivore which is small fishes. The maximum biomass is with the secondary carnivore or the large fishes.
The phytoplanktons or the producers can give sufficient energy as they reproduce more and live for a short period. If they have less biomass at any point, they increase their number as required by the zooplankton or the large fishes.
Also Read: Population
Things to Remember
- Biomass Pyramid is the graphical representation that determines the relationship between the factors such as numbers or biomass of different trophic levels.
- Only 10% energy of one trophic level passes on to the other levels.
- The biomass pyramid can be of two types: upright or inverted.
- Biomass is the mass of all the living organisms that belong to a particular sample. It is measured by a bomb calorimeter.
- The biomass is further classified into two types. This includes the species biomass and the community biomass.
- The biomass pyramid of grassland and tree ecosystem is upright while the biomass pyramid of the marine ecosystem is inverted.
- Biomass is calculated as the biomass of the organisms multiplied by the total organisms present at a specific trophic level of an ecosystem.
Also Read:
| Related Articles | ||
|---|---|---|
| What is Biomass? | Biogeochemical Cycles | Invertebrates |
| Genetic Drift | Predation | Parasitism |
Sample Questions
Ques. Define the pyramid of biomass and mention the types of biomass pyramid. (2 marks)
Ans. The biomass pyramid is a pyramid that is used to show the linking between the biomass, number, or productivity of trophic levels in an ecosystem. There are two important kinds of biomass pyramid: the inverted biomass pyramid and the upright biomass pyramid.
Ques. How can the primary producers in a marine ecosystem provide sufficient energy? (2 marks)
Ans. The primary producer of a marine ecosystem is phytoplanktons which can reproduce fast. They live for a short time. When the consumers require energy they reproduce more and fulfill the requirement. In the case of a marine ecosystem, the zooplankton is the herbivore, the small fish is the primary carnivore, and the large fish is the secondary carnivore.
Ques. What is Biomass? (2 marks)
Ans. Biomass is the mass of the living organisms/beings present in a given sample size. It is measured with the help of a bomb calorimeter. It is calculated as the dry weight present in grams or calories per unit area. The unit of biomass can be grams per square meter or tons per square kilometer. It is of two types: species biomass and community biomass.
Ques. Define species biomass and the community biomass. (2 marks)
Ans. Species biomass is the biomass that belongs to any particular species. It is the measure of biomass of any one kind of species.
Community biomass refers to the biomass that belongs to all the species present in a particular community.
Ques. Why is a number pyramid not considered in the case of a tree ecosystem? (2 marks)
Ans. We do not consider a number pyramid in the case of a tree ecosystem because there can be many insects present on a particular oak tree and these insects are further consumed by a fewer number of birds. Therefore, in a tree ecosystem, a biomass pyramid is considered better than the number pyramid.
Ques. What amount of energy is transferred from one trophic level to another? (2 marks)
Ans. From one trophic level to another, only 10% of the total energy of any trophic level is transferred. The 90% energy that is left is excreted out or is used up in the various metabolic activities.
Ques. Explain the structure of a grassland ecosystem. (2 marks)
Ans. A grassland ecosystem has grasses at its base or the bottom-most level which has the highest biomass. Then, there are rats, rabbits which fall under the category of herbivore at the 2nd trophic level. While there are secondary consumers like lizards and snakes present at the 3rd trophic level, the eagle being a tertiary consumer is present at the top that is on the 4th trophic level with the least biomass.
For Latest Updates on Upcoming Board Exams, Click Here: https://t.me/class_10_12_board_updates
Check-Out:



Comments