



Education Journalist | Study Abroad Lead
The coefficient of determination, often denoted as R squared in statistics, indicates how well a regression model explains the variation in the dependent variable. R-squared ranges from 0 to 1, with higher values signifying a better fit.
- It is used in statistical analysis to predict future events, evaluate hypotheses or explain an outcome in a linear regression setting.
- Coefficient of determination is calculated as the proportion of the variance in the dependent variable explained by the independent variable.
- It can be used to compare the fit of different regression models to the same data.
Suppose you are trying to predict the height of a person based on their weight. You collect data on the height and weight of a number of people and then fit a regression model to the data. The R-squared value of the model is 0.70. This means that the model explains 70% of the variation in the height of the people
Also Read: Quadratic Equations Formula
| Table of Content |
Key Terms: Adjusted coefficient of determination, coefficient of determination range, Correlation coefficient, coefficient of determination formula in regression, R square formula
Also Read: Relations and Functions
Coefficient of Determination
[Click Here for Sample Questions]
The coefficient of determination (R-squared) is a statistical measure of the proportion of predicted variance in the dependent variable based on the independent variable.
- R-squared is the square of the correlation coefficient (r).
- In linear regression, R-squared equals the square of the correlation between x and y variables.
- An R-squared of 0 indicates no prediction capability for the dependent variable from the independent variable.
- An R-squared of 1 indicates perfect prediction without any error.
- R-squared values between 0 and 1 indicate the percentage of predictability.
- Expected R2 values may vary across different fields.
- R2 tends to increase upon introducing new predictor variables, however, a higher R-squared doesn’t necessarily guarantee an association with outcomes.
- Adjusted R2 is a metric that adjusts for the number of predictors, considering only significant increases in the model's explanatory power.
- The regression line equation is given by p' = aq + r, where 'p' is the predicted function value of 'q'.
Read More: NCERT Solutions for class 11 mathematics Chapter 14: Mathematical Reasoning
Coefficient of Determination Formula
[Click Here for Sample Questions]
The coefficient of determination may be calculated in two ways: one using the sum of squares & the other using the correlation coefficient.
Formula 1. The sum of squares
Coefficient of determination can be calculated by the following formula:
R2 = 1 – (RSS/TSS)
Where,
- R2 = Coefficient of Determination: A measure of how well a regression model fits the data.
- RSS = Residuals sum of squares: The sum of the squared differences between the actual and predicted values of the dependent variable.
- TSS = Total sum of squares: The sum of the squared differences between the actual values of the dependent variable and their mean.
| Example: Suppose we have a regression model that predicts the height of a child based on their age. The following table shows the data for a sample of children:
Solution: First, we need to calculate the sum of squared residuals (RSS) and the total sum of squares (TSS). RSS = sum((y - \(\hat{y}\))2)
TSS = sum((y - \(\bar{y}\))2)
RSS = (115 - 117.5)2 + (120 - 122.5)2 + (125 - 127.5)2 + (130 - 132.5)2 RSS = 12.5 TSS: (115 - 121.25)^2 + (120 - 121.25)^2 + (125 - 121.25)^2 + (130 - 121.25)^2 TSS = 42.5 Now that we have calculated RSS and TSS, we can calculate R-squared using the following formula: R-squared = 1 - (RSS/TSS) R-squared = 1 - (12.5/42.5) R-squared = 0.7143 Therefore, the R-squared value for this regression model is 0.7143, which means that the model explains 71.43% of the variation in the height of the children. An R-squared value of 0.7143 is considered to be a good fit for the data. This means that the model is able to explain a significant portion of the variation in the dependent variable. |
Formula 2. Correlation Coefficient
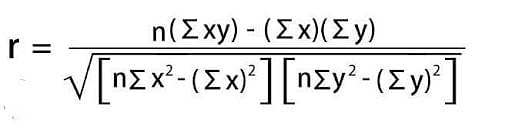
Where
- R= Correlation
- R2= Coefficient of determination of the regression equation
- N= Number of observations in the regression equation
- Xi= Independent variable of the regression equation
- X= Mean of the independent variable of the regression equation
- Yi= Dependent variable of the regression equation
- Y= Mean of the dependent variable of the regression equation
- σx = Standard deviation of the independent variable
- σy = Standard deviation of the dependent variable
| Example: Suppose we have the following data for the number of hours spent studying and the exam scores of 10 students:
Solution: Calculation of R-squared- N = 10 \(R^{2}=\left[\frac{10\cdot 13300 - 105\cdot 930}{\sqrt{\left[10\cdot 1365-\left(105\right)^{2}\right]\left[10\cdot 90250-\left(930\right)^{2}\right]}}\right]^2\) R2 =0.875 The R-squared value of 0.875 indicates that the model is able to explain 87.5% of the variation in the dependent variable (exam score). This means that the model is a good fit for the data. |
Read More: Union of Sets
Properties of Coefficient of Determination
[Click Here for Sample Questions]
R-squared is the ratio of explained variation to total variation, and it ranges from 0 to 1.
- The closer the R-squared is to 1, the stronger the linear relationship between the independent and dependent variables.
- R-squared is a measure of how well a regression model fits the data.
- R-squared can be used to compare the fit of different regression models.
- R-squared is not a measure of causation.
Adjusted R-squared
- Adjusted R-squared is a modification of the coefficient of determination that takes into account the number of variables in a data set.
- It penalizes points that are not consistent with the model.
- It increases when you add more data points to regression analysis but never reduces.
- This can be misleading, as it can lead to overfitting of the model.
- Adjusted R-squared is used to avoid the temptation to keep adding variables to the model.
- Adjusted R-squared can be negative, especially when R-squared is near zero.
Read More: Conic Sections
Things to Remember
- R-squared is a statistical measure of how well a regression model fits the data.
- It is calculated by taking the square of the correlation coefficient between the dependent and independent variables.
- R-squared ranges from 0 to 1, with higher values indicating a better fit of the model to the data.
- An R-squared of 0 means that the model does not explain any of the variations in the dependent variable.
- While an R-squared of 1 means that the model perfectly explains the variation in the dependent variable.
- Coefficient of Correlation Formula: R-squared = 1 - (SSR/SST)
Also Read:
Sample Questions
Ques. What is the use of the Coefficient of Correlation Formula? (2 Marks)
Ans. The correlation coefficient ( R2 ) is a measurable statistic of how near the data is to the regression line that has been fitted. For multiple regression, the correlation coefficient is also known as the coefficient of multiple determination. R2 of 0% shows that the model does not explain any of the variability in the response data around its mean.
Ques. What is the best use of the Coefficient of Determination? (5 Marks)
Ans. The most typical application of ( R2) is to see how well the regression model fits the data. R2 of 80%, for example, indicates that 80% of the data "accommodate" the regression model. A bigger coefficient usually indicates a better fit for the model. A big r-squared is superlative for the regression model, albeit this is not generally true. However, the coefficient's quality is influenced by a number of factors, including the variables' units, the characteristics of the variables utilised in the model, and the data transformation employed. As a result, even a large coefficient might cause issues with the regression model.
Ques. Given a value of 0.64 for the coefficient of determination. How do you calculate the correlation coefficient's value? (2 Marks)
(A) 0.04
(B) 0.40
(C) 0.08
(D) 0.80
Ans. The required answer is (D) 0.80
Explanation: The reason for this is that R2 represents the coefficient of determination. Because the range for the coefficient of correlation is -1 to +1, and therefore the range for the coefficient of determination is 0 to +1, a coefficient of determination of 0.64 suggests that the coefficient of correlation will be 0.8.
Ques. Write Properties of Coefficient of Determination. (2 Marks)
Ans. The following are the Properties of Coefficient of Determination
- It aids in calculating the ratio of how a variable that may be predicted from another fluctuates.
- This assessment may be used to judge how clear it is to make predictions based on the facts provided.
- It aids in the search for Total Variation / Explained Variation
- It also tells us how strong the relationship (linear) between the variables is.
- It aids in identifying the degree to which distinct variables are linked.
Ques. The relationship between two variables, m and n, is seen here, with m + 3n = 10. The relationship between the remaining two variables, p and q, is the same, with 2p + 5q = 25. The p/m coefficient is equal to 0.80. Calculate the q on m coefficient. (3 Marks)
Ans. We have, m + 3n = 10
n= m-103-13M -103 -13
Furthermore, 2p + 5q = 25
q= p-252-52p-252 -52
Since, we are familiar of the formula,
Then, 0.80 = -2.5-0.33-2.5-0.33× bqnbqn
0.80= 7.5 bqnbqn
Thus, Bqnbqn= 0.1333 × 0.80 = 8/75
Hence, the required answer is 8/75
Ques. What is the best use of the Coefficient of Determination? (3 Marks)
Ans. The most typical application of ( R2 ) is to see how well the regression model fits the data. R2 of 80%, for example, indicates that 80% of the data "accommodate" the regression model. A bigger coefficient usually indicates a better fit for the model. A big r-squared is superlative for the regression model, albeit this is not generally true. However, the coefficient's quality is influenced by a number of factors, including the variables' units, the characteristics of the variables utilised in the model, and the data transformation employed. As a result, even a large coefficient might cause issues with the regression model.
Ques. The number of white flowers and the number of red flowers are noted every week at a park during an observation. The observation readings of 4 successive weeks are as follows: Compute the coefficient of determination. (5 Marks)

Ans.
| X | Y | X2 | Y2 | XY |
|---|---|---|---|---|
| 1 | 3 | 1 | 9 | 3 |
| 3 | 5 | 9 | 25 | 15 |
| 4 | 2 | 16 | 4 | 8 |
| 2 | 6 | 4 | 36 | 12 |
| ∑x=10 | ∑y=16 | ∑x2=30 | ∑y2=74 | ∑xy=38 |
r = n(∑xy)−(∑x)(∑y) / √[n∑x2−(∑x)2][n∑y2−(∑y)2]
= 4×38−10×16 / √4×30−102][4×74−162]
= 4×38−10×16 / √[4×30−100][4×74−256]
= 4×38−10×16[4×30−100][4×74−256]
= 152−160 / √ [120−100[296−256]
= −8 / √[20][40]
= −8 / √800
= −8 / 28.28
= -0.28
Ques. The no. of pen & the no. of pencil are noted every week in storehouse during an observation. The observation readings of 4 successive weeks are as follows: Compute the coefficient of determination. (5 Marks)

Ans.
| X | Y | X2 | Y2 | XY |
|---|---|---|---|---|
| 1 | 4 | 1 | 16 | 4 |
| 2 | 3 | 4 | 9 | 6 |
| 3 | 2 | 9 | 4 | 6 |
| 4 | 1 | 16 | 1 | 4 |
| ∑x=10 | ∑y=10 | ∑x2=30 | ∑y2=30 | ∑xy=20 |
r = n(∑xy)−(∑x)(∑y) / √[n∑x2−(∑x)2][n∑y2−(∑y)2]
= 4×20−10×10 / √4×30−102][4×30−102]
= 4×20−10×10 / √[4×30−100][4×30−100]
= 80 − 100 / √ [120−100[120−100]
= −20 / √[20][20]
= −20 / √400
= −20 / 20
= −1
Ques. For the following set of data, use the coefficient of determination formula to calculate the coefficient of determination: (5 Marks)

Ans.
| X | Y | X2 | Y2 | XY |
|---|---|---|---|---|
| 3 | 4 | 9 | 16 | 12 |
| 4 | 3 | 16 | 9 | 12 |
| 3 | 4 | 9 | 16 | 12 |
| 4 | 3 | 16 | 9 | 12 |
| ∑x=14 | ∑y=14 | ∑x2=50 | ∑y2=50 | ∑xy=48 |
r = n(∑xy)−(∑x)(∑y) / √[n∑x2−(∑x)2][n∑y2−(∑y)2]
= 4×48−14×14 / √4×50−142][4×50−142]
= 4×48−14×14 / √[4×50−196][4×50−196]
= 192 − 196 / √ [200−196[200−196]
= −4 / √[4][4]
= −4 / √16
= −4 / 4
= −1
Ques. Calculate the coefficient of determination using the coefficient of determination formula for given data: (5 Marks)

Ans.
| X | Y | X2 | Y2 | XY |
|---|---|---|---|---|
| 2 | 4 | 4 | 16 | 8 |
| 3 | 6 | 9 | 36 | 18 |
| 6 | 8 | 36 | 64 | 48 |
| 8 | 10 | 64 | 100 | 80 |
| ∑x=19 | ∑y=28 | ∑x2=113 | ∑y2=216 | ∑xy=154 |
r = n(∑xy)−(∑x)(∑y) / √[n∑x2−(∑x)2][n∑y2−(∑y)2]
= 4×154−19×28 / √[4×113−192][4×216−282]
= 4×154−19×28 / √[4×113−361][4×216−784]
= 616 − 532 / √ [452−361[864−784]
= 84 / √[91][80]
= 84 / √7280
= 84 / 85.32
= 0.98
Ques. How is R2 calculated? (1 mark)
Ans. R-squared is calculated using the following formula R-squared = 1 - (SSR/SST).
Ques. What is a good coefficient of determination? (5 marks)
Ans. A good coefficient of determination (R-squared) depends on the context and the specific application. However, in general, a value of 0.7 or higher is considered to be good. This means that the model explains at least 70% of the variation in the dependent variable.
Here is a table of R-squared values and their interpretations:
| R-squared value | Interpretation |
|---|---|
| 0.9 or higher | Excellent fit |
| 0.7 to 0.9 | Good fit |
| 0.5 to 0.7 | Moderate fit |
| 0.3 to 0.5 | Weak fit |
| 0.1 to 0.3 | Very weak fit |
| Less than 0.1 | No fit |
Just because a model has a high R-squared value does not mean that the independent variables cause the dependent variable.
Ques. What are the uses of the Coefficient of Correlation Formula? (3 marks)
Ans. Some of the applications of the Coefficient of Correlation Formula are as follows –
- It is a statistical measure of the strength and direction of the linear relationship between two variables.
- It ranges from -1 to 1, with higher values indicating a stronger relationship.
- It can be used to identify relationships between variables and predict the value of one variable based on the value of the other.
- It also compares the relationships between different variables and the same variable.
- It is used in a wide variety of fields, including business, finance, and science.
Ques. What is the difference between the coefficient of determination and the correlation coefficient? (3 marks)
Ans. The coefficient of determination (R-squared) and correlation coefficient (r) are both statistical measures of the relationship between two variables.
- R-squared is a measure of model fit, while r is a measure of the strength and direction of the linear relationship.
- R-squared ranges from 0 to 1, while r ranges from -1 to 1.
- A higher R-squared value indicates a better fit of the model to the data, while a higher r value indicates a stronger linear relationship between the two variables.
Ques. If r = 0.8 coefficient of determination is? (2 marks)
Ans. If r = 0.8, then the coefficient of determination (R-squared) is 0.64. This means that the model explains 64% of the variation in the dependent variable.
R-squared = r2 = 0.82 = 0.64
For Latest Updates on Upcoming Board Exams, Click Here: https://t.me/class_10_12_board_updates
Check-Out:



Comments