



Education Journalist | Study Abroad Lead
Control charts are a statistical-based controlling tool that assists in monitoring the improvements in the process over time. The goal of these control charts would be to find any causes of variation as well as to analyze the process improvements that have been made. To successfully use control charts, understanding the information in variation is essential.
Also Read: Difference Between Variance and Standard Deviation
| Table of Content |
Key Takeaways: Control charts, Statistics, Standard deviation, Graphs, Planning and controlling, Control Limits, Variation, Interval
What is a Control Chart?
[Click Here for Sample Questions]
A control chart is a statistical process or SPC chart, which is one of several graphical tools typically used in quality control analysis to understand how a process changes over time.
The main fundamentals of a control chart are:
- A visual representation of a time series graph that illustrates data points collected at specific time intervals.
- A horizontal control line to easily picture variations and trends.
- Horizontal lines, displaying upper and lower control limits, are placed at equal distances above and below the control line. These upper and lower thresholds are calculated from the data on the time-series graph over a specified period of time.
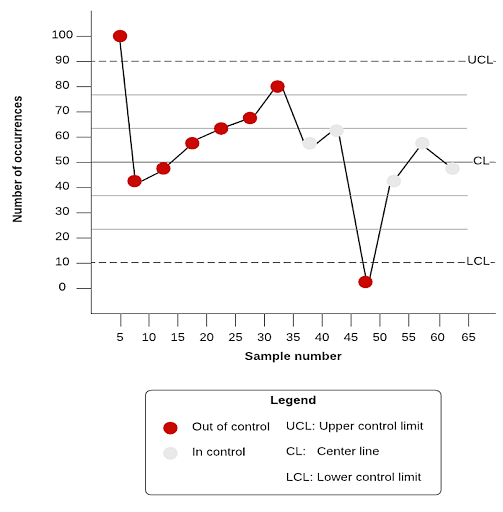
Control Chart
The video below explains this:
Control Chart Detailed Video Explanation:
Also Read:
| Related Articles | ||
|---|---|---|
| Statistics | Universal sets | Real valued function |
| Venn diagram | Mode of grouped data | Conditional probability |
Benefits of Using a Control Charts
[Click Here for Sample Questions]
Control charts can help us:
- Understand the variations present in processes. Variations that are within our control limits indicate that the process is working. Variations that go outside of our control limits indicate problems that need to be corrected.
- Understand problem indicators to take corrective action.
- Observe patterns within plotted points. These patterns indicate causes, which can help us find possible solutions.
- Forecast future performance.
- Make new ideas for improving quality based on our analysis.
Also Read: Bayes Theorem
How to Make a Control Chart?
[Click Here for Sample Questions]
Control charts are meant to separate ‘common cause’ variations from ‘special cause’ variations. With a control chart, one can observe a process variable over time.
Follow these steps to make a chart:
- Fix a time period, generally noted on the X-axis of the control chart, to collect the necessary data and establish the control limits.
- Collect data and plot it on the control chart.
- Calculate the average of the data and add a control line.
- Calculate upper and lower control limits and add these lines to the chart.
- Note any “out-of-control signals,” or points where data falls outside the control limits.
- Investigate the cause and adjust the process to minimize the risk of these abnormalities.
- With the control limits in mind, continue to track the process.
Features of Control Chart
[Click Here for Sample Questions]
- It has points displaying a statistic (example- mean, range, proportion) measurements of a quality characteristic in data taken from the process at different times.
- A center line is graphed at the value of the mean or median of the statistic
- The standard deviation of the statistic is obtained using all the samples. In the case of X- R charts, it is an approximation of standard deviation, it does not make the assumption of homogeneity of process over time that the standard deviation takes.
- Upper and lower control limits that indicate the threshold at which the process output is considered statistically 'unlikely' and are drawn typically at 3 standard deviations (3 s) from the center line.
Also read: Remainder theorem
Types of Control Charts
[Click Here for Sample Questions]
Various types of control charts are:
- Univariate Control Chart: ‘uni’ means one, thus it is a graphical representation (chart) of one quality characteristic called a univariate control chart.
- Multivariate Control Chart: It is a graphical representation of a statistic that summarizes or represents more than one quality characteristic.
- Control Charts for Variables: The control charts of variables are grouped based on the statistics of the subgroup summary which is plotted on the chart.
- X¯ chart
- R Chart
- S Chart
The X¯ chart is for the subset of means, the R chart is for the ranges of the subgroup, and the S chart represents standard deviations of the subgroup.
- Levey - Jennings Charts: Levey -Jennings charts are used to display the mean process which is based on a long-term sigma with control limits. The control limits are positioned so that the distance between them and the centreline is ‘3s’. The standard deviation values for these charts are calculated by the same process as the standard deviation for the distribution platform.
- Control Charts for Attributes: This type of data is essentially continuous and is based on the theoretical concept of continuous data. Count data is a different type of data present which is also called level counts of character data.
- Pre-summarize Charts: The data can be set to one measurement unit when the data contains repetitive measurements of the same unit method. Essentially, the pre-summarized chart plots the procedure columns into standard deviations of sample means which is based on the size of the sample.
When to use a control chart?
[Click Here for Sample Questions]
- Monitoring ongoing processes by finding and amending problems as they occur
- Forecasting the expected range of results from a process.
- Defining whether a process is stable.
- Understanding patterns of process variation from special causes (or non-routine events) or common causes (or routine events)
- Deciding whether the quality improvement project should prevent the problems or change the process.
Also read: Independent events in probability
Things to Remember
- Controlling is the method of confirming that actual activities follow the planned activities.
- The significance of managerial control is that it helps in achieving organizational goals. Controlling also benefits in judging the accuracy of standards, ensuring efficient utilization of resources, boosting employee morale, creating a system of order and discipline in the organization, and coordinating different processes so that they all work together in tandem to meet targets.
- Controlling has certain limitations too. Resistance from its employees,(external events) the process becoming a costly affair are a few examples. Furthermore, it may not be possible for the management to set quantitative standards of performance in the absence of which controlling exercise loses some of its effectiveness.
- The process of control encompasses setting standards, measurement, comparison of actual performance with standards, and analysis of deviations to take corrective action.
Also Read:
Sample Questions
Ques: What is the meaning of controlling? (NCERT) (2 marks)
Ans: Controlling is making sure that the organization is running effectively. Controlling confirms that an organization's resources are being used effectively and efficiently for the achievement of the desired objective. Controlling is a goal-oriented tool and a very important managerial tool. Managers are able to compare actual performance with the planned performance. In order to control the process at all levels, the manager needs to perform a controlling function.
Ques: Planning is looking ahead and controlling is looking back. Explain. (NCERT) (3 marks)
Ans: Planning and controlling are intertwined. Planning is the primary technique of every organization- it is the thought process, which is making plans to meet the desired objectives in the future. Controlling is a systematic tool that measures the actual performance with the planned performance. It compares and analyses the whole process of an organization and takes corrective actions. Thus, planning and controlling both are backward-looking as well as forward-looking functions.
Ques: ‘An effort to control everything may end up in controlling nothing’. Explain. (NCERT) (3 marks)
Ans: Controlling everything is basically controlling nothing. Controlling various activities is neither feasible nor economical. Control thus emphasizes on KRAs (Key Result Areas). It entails that instead of controlling all activities, it is necessary to control critical points.
Ques: Write a short note on budgetary control as a technique of managerial control. (NCERT) (2 marks)
Ans: Budgetary control is a technique of managerial control in which all processes are planned and will help one in knowing how much one has to spend in order to achieve the future result. It compared the actual outcome with budgetary standards. This comparison discloses the necessary actions to be taken so that the organizational goals are accomplished.
Ques: What are PERT and CPM? (NCERT) (3 marks)
Ans: Programme evaluation, review technique and critical path method are important network tools useful in planning and controlling. These techniques are particularly useful in planning, scheduling, and implementing time-bound projects. This involves performance of a variety of complex, diverse, and inter-related activities. These tools deal with time scheduling, resource allocation for these activities and look for effective implementation of projects within a given time schedule and structure of costs.
Ques: What is Management Information System? (NCERT) (2 marks)
Ans: MIS is a computer-based information system that provides information and support for effective managerial decision-making. A decision-maker needs accurate and timely information. MIS gives essential information to the managers by systematically processing massive data generated in an organization.
Ques: Write a short note on Management Audit (NCERT) (3 marks)
Ans: Management audit refers to a systematic assessment of the overall performance of the management of an organization. The purpose is to examine the efficiency and effectiveness of management and to improve its performance in future periods. The main advantages are
- Helps to find weaknesses.
- It helps to improve the control system.
- For apprising existing managerial policies and strategies in the light of changes.
Ques: Shouldn't Control Charts be used Everywhere? (2 marks)
Ans: Control charts are helpful but not appropriate for all the processes. One can never be fully certain that a control chart will always work in a specific area and will fail in the other. Though, it is always beneficial to plot data over time and understand what happens. One should always have an objective in mind before starting a control chart. For example, if one is working on a six-sigma project and needs to comprehend the type of variation he/she is dealing with.
Ques: What are the advantages of control charts (3 marks)
Ans: Control charts use common causes (routine causes) to set the control limits. Control charts give clear assistance on adjusting or leaving the process. Control charts determine process improvement and are acknowledged by customers. Control charts offer a written record or chart. Control charts are in a common language for all levels of staff
For Latest Updates on Upcoming Board Exams, Click Here: https://t.me/class_10_12_board_updates
Check-Out:



Comments