



Content Curator
Probability and statistics are the branches of mathematics dealing with the laws regulating random events, including the collection, analysis, interpretation, and display of numerical data.
- The study of probability originated in the 17th century as a tool for gambling and insurance.
- Now it is an indispensable part of both social and natural science.
- Statistics can be traced back thousands of years to census counts.
- However, as a distinct scientific discipline, it was developed in the early 19th century as the study of populations, economies, and moral actions.
- Later in that century as the mathematical tool for analyzing such numbers.
- Both probability and statistics use a variety of Greek/Latin-based symbols as placeholders for various objects and quantities.
| Table of Content |
Key Terms: Probability, Statics, Population Mean, Variance, Standard Deviation, Basics of statistics, Central tendency, Dispersion, Mean, Median, Mode
Probability
[Click Here for Sample Questions]
Probability is a field of mathematics concerned with the possibility of a random experiment occurring.
- Many occurrences are impossible to anticipate with absolute certainty.
- So the most we can do is estimate how probable they are to occur using the concept of probability.
- Probability is an area of mathematics that explores the interactions between mathematical concepts and real-world phenomena.
- The probability of an occurrence is stated as a number between 0 and 1, with 0 denoting impossibility and 1 denoting certainty.
- The higher the likelihood, the more probable it is that the event will take place.
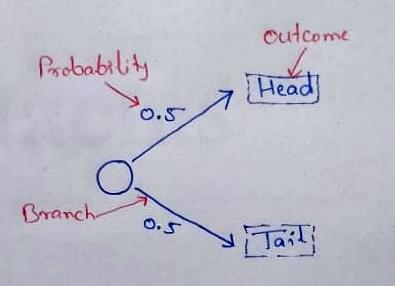
Example of ProbabilityExample: The throwing of an impartial coin The coin is unbiased, therefore there are only two possible outcomes:
The chance of "heads" is the same as the probability of "tails"; no other possibilities are possible if the coin lands flat.
|
Also Read:
| Related Topics | ||
|---|---|---|
| Events in Probability | Probability Distribution | Probability Important Questions |
| Statistics Important Questions | MCQ on Probability | Statistics and Probability MCQs |
Statistics
[Click Here for Sample Questions]
Statistics can be stated simply as the study and manipulation of data. It with the analysis and calculation of numerical data.
- Mathematical statistics is the application of mathematics to statistics.
- It was initially meant as the science of the state – the collecting and analysis of information about a country, such as its economy, population, etc.
- Various mathematical techniques are used for different analytics.
- Such as linear algebra, stochastic analysis, differential equations, and measure-theoretic probability theory.
- The basics of statistics include the measures of central tendency and dispersion.
- Mean, median, and mode are the central tendency, whereas variance and standard deviation are the dispersions.

Real-Life Examples of StatisticsA few real-life examples of statistics are Example 1: To determine the mean of the marks obtained by each student in the class with a strength of 50. The average value in this case represents the statistics of the marks obtained. Example 2: Assume you need to know how many people work in a city.
|
Types of Statistics
Basically, there are two types of statistics
- Descriptive Statistics
- Inferential Statistics
Descriptive Statistics
Descriptive statistics are used to summarize and interpret the data.
- A population sample is used for summarization, and numerous parameters such as mean and standard deviation are used.
- Descriptive statistics use charts, graphs, and summary measures to organize, represent, and explain a set of data.
- Histograms, pie charts, bars, and scatter plots are popular methods for summarizing data and presenting it in tables or graphs.
- Descriptive statistics are exactly that: descriptive statistics.
- They do not require normalization beyond the data they collect.
Inferential Statistics
Using inferential statistics, we attempt to understand the meaning of descriptive statistics.
- After the data has been collected, reviewed, and summarized, we use inferential statistics to explain its significance.
- In inferential statistics, the probability principle is used to examine if patterns observed in a research sample may be extrapolated to the larger population from which the sample was obtained.
- Inferential statistics are used to test hypotheses and study relationships between variables, as well as to predict population numbers.
- Inferential statistics are used to draw conclusions and inferences from samples, allowing for more accurate generalizations.
List of Probability and Statistics Symbols
[Click Here for Sample Questions]
The list of Probability and Statistics symbols, name definitions, and examples are given in the below table.
| Symbol | Symbol Name | Meaning/definition | Example |
|---|---|---|---|
| P(A ∩ B) | probability of events intersection | probability that of events A and B | P(A∩B) = 0.5 |
| P(A) | probability function | probability of event A | P(A) = 0.5 |
| P(A | B) | conditional probability function | probability of event A given event B occurred | P(A | B) = 0.3 |
| P(A ∪ B) | probability of events union | probability that of events A or B | P(A∪B) = 0.5 |
| F(x) | cumulative distribution function (CDF) | F(x) = P(X ≤ x) | |
| f (x) | probability density function (pdf) | P(a ≤ x ≤ b) = ∫ f (x) dx | |
| E(X) | expectation value | expected value of random variable X | E(X) = 10 |
| μ | population mean | mean of population values | μ = 10 |
| var(X) | variance | variance of random variable X | var(X) = 4 |
| E(X | Y) | conditional expectation | expected value of random variable X given Y | E(X | Y=2) = 5 |
| std(X) | standard deviation | standard deviation of random variable X | std(X) = 2 |
| σ2 | variance | variance of population values | σ2 = 4 |
| \(\widetilde {x}\) | median | middle value of random variable x | \(\widetilde {x}=5\) |
| σX | standard deviation | standard deviation value of random variable X | σX = 2 |
| corr(X,Y) | correlation | correlation of random variables X and Y | corr(X,Y) = 0.6 |
| cov(X,Y) | covariance | covariance of random variables X and Y | cov(X,Y) = 4 |
| ρX,Y | correlation | correlation of random variables X and Y | ρX,Y = 0.6 |
| Mo | mode | value that occurs most frequently in population | |
| Md | sample median | half the population is below this value | |
| MR | mid-range | MR = (xmax+xmin)/2 | |
| Q2 | median / second quartile | 50% of the population are below this value = median of samples | |
| Q1 | lower / first quartile | 25% of the population are below this value | |
| x | sample mean | average / arithmetic mean | x = (2+5+9) / 3 = 5.333 |
| Q3 | upper / third quartile | 75% of population are below this value | |
| s | sample standard deviation | population samples standard deviation estimator | s = 2 |
| s2 | sample variance | population samples variance estimator | s2 = 4 |
| X ~ | distribution of X | distribution of random variable X | X ~ N(0,3) |
| zx | standard score | zx = (x–x) / sx | |
| U(a,b) | uniform distribution | equal probability in range a,b | X ~ U(0,3) |
| N(μ,σ2) | normal distribution | gaussian distribution | X ~ N(0,3) |
| gamma(c, λ) | gamma distribution | f (x) = λ c xc-1e-λx / Γ(c), x≥0 | |
| exp(λ) | exponential distribution | f (x) = λe–λx , x≥0 | |
| F (k1, k2) | F distribution | ||
| Bin(n,p) | binomial distribution | f (k) = nCk pk(1-p)n-k | |
| χ2(k) | chi-square distribution | f (x) = xk/2-1 e–x/2 / ( 2k/2 Γ(k/2) ) | |
| Geom(p) | geometric distribution | f (k) = p (1-p) k | |
| Poisson(λ) | Poisson distribution | f (k) = λke–λ / k! | |
| Bern(p) | Bernoulli distribution | ||
| HG(N,K,n) | hypergeometric distribution |
Also check:
Things to Remember
- Probability is a branch of mathematics that deals with the possibility of a random experiment happening.
- The probability of an event occurring is expressed as a number between 0 and 1, with 0 representing impossibility and 1 representing certainty.
- The formula for probability: Probability of event to happen P(E) = Number of favorable outcomes/Total Number of outcomes
- The probability of an event A is written as P(A), p(A), or Pr(A).
- Statistics can be stated simply as the study and manipulation of data.
- The basics of statistics include the measures of central tendency and dispersion.
- The central tendency is represented by the mean, median, and mode.
- The dispersions are represented by variance and standard deviation.
Sample Questions
Ques. What is Probability? (2 Marks)
Ans. Probability refers to the possibility of any random event's outcome. The meaning of the term is to determine the likelihood of an event occurring.
Ques. What is Statistics? (2 Marks)
Ans. The study of data collection, analysis, interpretation, presentation, and organization is known as statistics. It is a method for collecting and summarizing data.
Ques. There are 6 pillows in a bed, 3 are red, 2 are yellow and 1 is blue. What is the probability of picking a yellow pillow? (1 Mark)
Ans. The probability is calculated by dividing the number of yellow pillows in the bed by the total number of pillows, i.e. 2/6 = 1/3.
Ques. There is a container full of colored bottles, red, blue, green, and orange. Some of the bottles are picked out and displaced. Sumit did this 1000 times and got the following results: (3 Marks)
No. of blue bottles picked out: 300
No. of red bottles: 200
No. of green bottles: 450
No. of orange bottles: 50
a) What is the probability that Sumit will pick a green bottle?
Ans: For every 1000 bottles picked out, 450 are green.
b) If there are 100 bottles in the container, how many of them are likely to be green?
Ans: The experiment implies that 450 out of 1000 bottles are green. Therefore, out of 100 bottles, 45 are green.
Ques. Find the probability of ‘getting 3 on rolling a die. (2 Marks)
Ans. Sample Space = S = {1, 2, 3, 4, 5, 6}
Total number of outcomes = n(S) = 6
Let A be the event of getting 3.
Number of favourable outcomes = n(A) = 1
i.e. A = {3}
Probability, P(A) = n(A)/n(S) = 1/6
Hence, P(getting 3 on rolling a die) = 1/6
Ques. Draw a random card from a pack of cards. What is the probability that the card drawn is a face card? (2 Marks)
Ans. A standard deck has 52 cards.
Total number of outcomes = n(S) = 52
Let E be the event of drawing a face card.
Number of favourable events = n(E) = 4 x 3 = 12 (considered Jack, Queen and King only)
Probability, P = Number of Favourable Outcomes/Total Number of Outcomes
P(E) = n(E)/n(S)
= 12/52
= 3/13
P(the card drawn is a face card) = 3/13
Ques. A vessel contains 4 blue balls, 5 red balls, and 11 white balls. If three balls are drawn from the vessel at random, what is the probability that the first ball is red, the second ball is blue, and the third ball is white? (2 Marks)
Ans. Given,
The probability to get the first ball is red or the first event is 5/20.
Since we have drawn a ball for the first event to occur, then the number of possibilities left for the second event to occur is 20 – 1 = 19.
Hence, the probability of getting the second ball as blue or the second event is 4/19.
Again with the first and second events occurring, the number of possibilities left for the third event to occur is 19 – 1 = 18.
And the probability of the third ball being white or the third event being 11/18.
Therefore, the probability is 5/20 x 4/19 x 11/18 = 44/1368 = 0.032.
Or we can express it as P = 3.2%.
Ques. Two dice are rolled, find the probability that the sum is:
(1) equal to 1
(2) equal to 4
(3) less than 13 (4 Marks)
Ans. To find the probability that the sum is equal to 1 we have to first determine the sample space S of two dice as shown below.
S = { (1,1),(1,2),(1,3),(1,4),(1,5),(1,6)
(2,1),(2,2),(2,3),(2,4),(2,5),(2,6)
(3,1),(3,2),(3,3),(3,4),(3,5),(3,6)
(4,1),(4,2),(4,3),(4,4),(4,5),(4,6)
(5,1),(5,2),(5,3),(5,4),(5,5),(5,6)
(6,1),(6,2),(6,3),(6,4),(6,5),(6,6) }
So, n(S) = 36
1) Let E be the event “sum equal to 1”. Since, there are no outcomes which where a sum is equal to 1, hence,
P(E) = n(E) / n(S) = 0 / 36 = 0
2) Let A be the event of getting the sum of numbers on dice equal to 4.
Three possible outcomes give a sum equal to 4 they are:
A = {(1,3),(2,2),(3,1)}
n(A) = 3
Hence, P(A) = n(A) / n(S) = 3 / 36 = 1 / 12
3) Let B be the event that the sum of numbers on dice is less than 13.
From the sample space, we can see all possible outcomes for event B, which gives a sum less than B. Like:
(1,1) or (1,6) or (2,6) or (6,6).
So you can see the limit of an event to occur is when both dies have number 6, i.e. (6,6).
Thus, n(B) = 36
Hence,
P(B) = n(B) / n(S) = 36 / 36 = 1
Ques. Find the probability of getting a number less than 5 when a dice is rolled by using the probability formula.To find: Probability of getting a number less than 5. (2 Marks)
Ans. Given: Sample space = {1,2,3,4,5,6}
Getting a number less than 5 = {1,2,3,4}
Therefore, n(S) = 6
n(A) = 4
Using Probability Formula,
P(A) = (n(A))/(n(s))
p(A) = 4/6
m = 2/3
Ques. What is the probability of getting a sum of 9 when two dice are thrown? (2 Marks)
Ans. There is a total of 36 possibilities when we throw two dice.
To get the desired outcome i.e., 9, we can have the following favorable outcomes.
(4,5),(5,4),(6,3)(3,6). There are 4 favorable outcomes.
Probability of an event P(E) = (Number of favorable outcomes) ÷ (Total outcomes in a sample space)
Probability of getting number 9 = 4 ÷ 36 = 1/9
Therefore the probability of getting a sum of 9 is 1/9.
Ques. What is the probability of getting a sum of 10 when two dice are thrown? (2 Marks)
Ans. There are 36 possibilities when we throw two dice.
The desired outcome is 10. To get 10, we can have three favorable outcomes.
{(4,6),(6,4),(5,5)}
Probability of an event = number of favorable outcomes/ sample space
Probability of getting number 10 = 3/36 =1/12
Ques. In a bag, there are 6 blue balls and 8 yellow balls. One ball is selected randomly from the bag. Find the probability of getting a blue ball. (2 Marks)
Ans. Let us assume the probability of drawing a blue ball to be P(B)
Number of favorable outcomes to get a blue ball = 6
Total number of balls in the bag = 14
P(B) = Number of favorable outcomes/Total number of outcomes = 6/14 = 3/7
Ques. There are 5 cards numbered: 2, 3, 4, 5, 6. Find the probability of picking a prime number, and putting it back, you pick a composite number. (2 Marks)
Ans. The two events are independent. Thus we use the product of the probability of the events.
P(getting a prime) = n(favorable events)/ n(sample space) = {2, 3, 5}/{2, 3, 4, 5, 6} = 3/5
p(getting a composite) = n(favorable events)/ n(sample space) = {4, 6}/{2, 3, 4, 5, 6}= 2/5
Thus the total probability of the two independent events= P(prime) × P(composite)
= 3/5 × (2/5)
= 6/25
Ques. Find the probability of getting a face card from a standard deck of cards using the probability formula. (2 Marks)
Ans. To find:
Probability of getting a face card
Given: Total number of cards = 52
Number of face cards = Favorable outcomes = 12
Using Probability Formula,
Probability = (Favorable Outcomes)÷(Total Favourable Outcomes)
P(face card) = 12/52
m = 3/13
For Latest Updates on Upcoming Board Exams, Click Here: https://t.me/class_10_12_board_updates
Also Read:



Comments